The ETF/No Load Fund Tracker
Monthly Review—April 30, 2014
US Stocks Show Mixed Gains In April; Europe Fares Better
US equity indexes showed a mixed picture in April with the blue-chip Dow Jones Industrial Average and the benchmark S&P 500 heading higher.
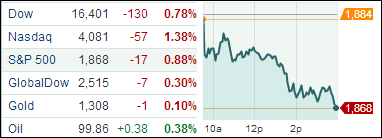
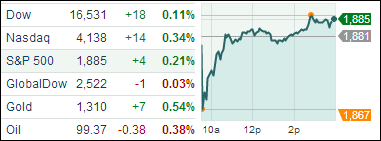
The DJIA hit a record high for the first time this year while the S&P 500 staged only a modest advance. The Dow finished the month up 0.75 percent while the S&P 500 added 0.6%. The Nasdaq bucked the trend and lost 2%.
The US jobs market made a strong comeback in April after losing steam in the first-quarter due to unusually cold weather conditions. Data released by the Labor Department showed the economy added 288,000 jobs in April, marking the best monthly gain since January 2012. The unemployment rate dropped to 6.3 percent, the lowest since September 2008.
The labor participation rate slumped to 62.8 percent in April from 63.2 percent the prior month, matching a 35-year low. The government attributed the decline in participation rate to fewer people entering the workforce, rather than more people leaving the labor force.
The US Fed cut its monthly assets purchase program by another $10 billion to $45 billion, as was widely expected.
The consumer sentiment index rose to a final reading of 84.1 in April from 80.0 the prior month. That was the most since July and well above the 82.8 reading economists had predicted.
The Chicago business barometer revealed the Chicago purchasing managers’ index rose to 63.0 in April from 55.9 in March, marking the fastest gain in six months. Production and new orders rose sharply, indicating the economy is getting its momentum back.
Separately, a gauge for pending-home sales rose 3.4 percent in March, the most in three months, the National Association of Realtors said. That was also the first gain in nine months, indicating the decline in sales of existing homes may have found a bottom.
On the downside, growth in the first quarter nearly ground to a halt, brought about by one of the worst winters in years. GDP grew at a dismal 0.1 percent annual pace from January through March, marking the weakest performance in three years. Most economists had called for a seasonally-adjusted 1 percent increase from a 2.6 percent rise in the final three months of 2013.
Separately, data showed single-family home sales dropped by a steep 14.5 percent to a 384,000 annual pace in March, missing forecasts of an annualized gain of 450,000. That was the worst number since July last year.
Across the Atlantic, European stocks broadly tracked US equities though tensions between Russia and Ukraine continue to cloud sentiment. The pan-European Stoxx Europe 600 added 1.1 percent for April.
The constant threat of a deflationary spiral across the 18-member currency region eased somewhat as April inflation edged higher to 0.7 percent from a near four-year low of 0.5 percent in March. Inflation remained below 1 percent for the seventh month in a row.
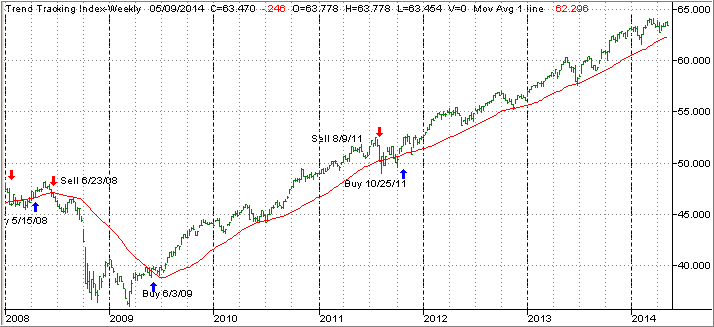
Now to the technicals: Our main directional indicator, the Domestic Trend Tracking Index (TTI), remains off its February highs but is still positioned above its long term trend line:
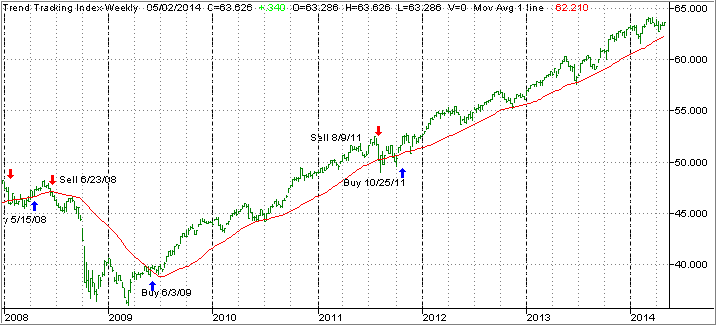
The index itself (green line) now hovers above the trend line (red) by +2.41% (last month +2.91%).
Despite the volatility in April, with the S&P 500 swinging wildly between a low of 1,816 and a high of 1,889, a spread of 73 points, none of our trailing sell stops were affected during the race to the low side. That means we will continue to hold all positions subject to their respective sell stops.
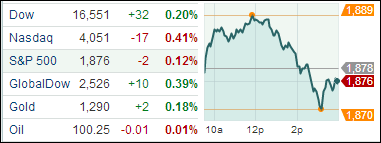
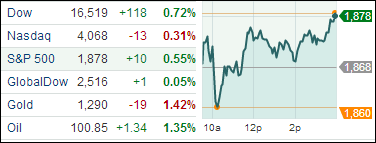
Let’s now hone into the actual volatility that out current main holdings experienced during April, which is shown in the 30-day chart below:
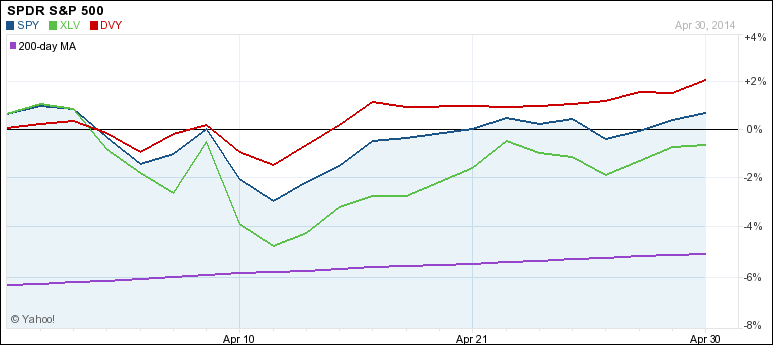
XLV (Healthcare) took the biggest hit but recovered nicely before its sell stop was triggered. In the end, XLV now shows a YTD gain of +5.19%, which puts in second place. Leading the pack is the DJ Divided Index (DVY), which was the most stable of this trio and leads YTD with +5.77%. The S&P 500 (SPY) hovered in the middle in regards to volatility and sports a gain of +2.41% YTD.
With the S&P 500 nibbling at its historical 1,900 level, pullbacks and rallies will continue to be part of the investing landscape. You’ll never know what might push the index above and how long that kind of a breakout might last.
Yet, at the same time, the danger of a serious pullback is ever present, and we need to be prepared to deal with either scenario. To my way of thinking, the only true measure is the long-term trend which, when combined with our trailing sell stop discipline, should limit our downside risk in the event the bears gain the upper hand again.
Right now, the major trend remains bullish, and we will stay onboard and ride it as long as it lasts.