ETF/No Load Fund Tracker Newsletter For May 9, 2014
ETF/No Load Fund Tracker StatSheet
————————————————————-
THE LINK TO OUR CURRENT ETF/MUTUAL FUND STATSHEET IS:
https://theetfbully.com/2014/05/weekly-statsheet-for-the-etfno-load-fund-tracker-newsletter-updated-through-05082014/
————————————————————
Market Commentary
Friday, May 9, 2014
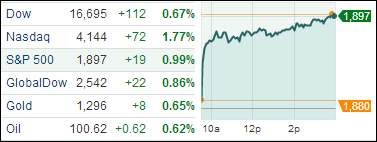
DOW SQUEEZES TO NEW HIGH AS THE END OF Q1’s EARNINGS SEASON APPROACHES

[Chart courtesy of MarketWatch.com]
1. Moving The Markets
The Dow squeezed past a new record high today, gaining 0.2%. However, celebrations remained fairly mild given that the Dow’s performance is essentially flat for the year. The S&P 500 and the Nasdaq both closed out the day in positive territory, which was a nice way to end a rather sour week of trading given the continued selloff of high-flying tech and biotech stocks.
Throughout the week it has been hard to overlook the headlines surrounding the upcoming IPO of Alibaba later this year. Wall Street analysts remain optimistic on Alibaba, due to its huge size and growth potential in the massive Chinese online consumer market. Many are speculating that the IPO will be the largest of all time and thus has the potential to top the $17.9 billion IPO of Visa.
Well, the Q1 earnings season is coming to a close, and near final results show that corporations are continuing to fare well. With 90% of companies in the S&P 500 having reported first-quarter results, earnings are up 5.4% year-over-year and 69% of companies have posted better-than-expected earnings according to Thompson Reuters. This all bodes well for an optimistic outlook on continued economic growth as we continue on into the second quarter of the year.
Nonetheless, markets remain stuck in a sideways pattern, plagued by overvaluation speculation and remnants of the gains many realized on the mega performance of 2013’s market.
Our 10 ETFs in the Spotlight went sideways during this bouncy week; however, one of them made a new high today and 9 of them are on the plus side YTD.
2. ETFs in the Spotlight
In case you missed the announcement and description of this section, you can read it here again.
It features 10 broadly diversified ETFs from my HighVolume list as posted every Monday. Furthermore, they are screened for the lowest MaxDD% number meaning they have been showing better resistance to temporary sell offs than all others over the past year.
In other words, none of them ever triggered their 7.5% sell stop level during this time period, which included a variety of severe market pullbacks but no move into outright bear market territory.
Here are the 10 candidates:
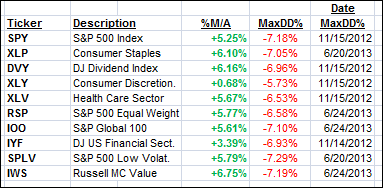
All of them are in “buy” mode, meaning their prices are above their respective long term trend lines by the percentage indicated (%M/A).
Year to date, here’s how the above candidates have fared so far:
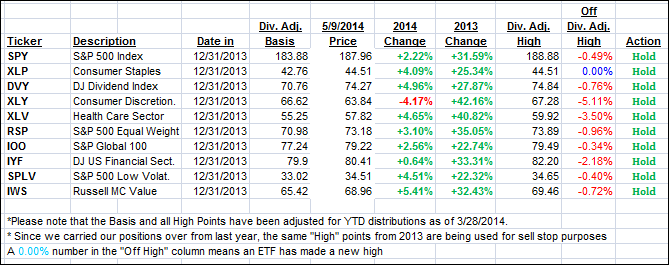
To be clear, the first table above shows the position of the various ETFs in relation to their respective long term trend lines (%M/A), while the second one tracks their trailing sell stops in the “Off High” column. The “Action” column will signal a “Sell” once the -7.5% point is taken out in the “Off High” column.
3. Domestic Trend Tracking Indexes (TTIs)
Our Trend Tracking Indexes (TTIs) slipped from last Friday’s close but remain above their respective long-term trend lines by the following percentages:
Domestic TTI: +2.05% (last Friday +2.42%)
International TTI: +2.87% (last Friday +3.61%)
Have a great weekend.
Ulli…
Disclosure: I am obliged to inform you that I, as well as advisory clients of mine, own some of these listed ETFs. Furthermore, they do not represent a specific investment recommendation for you, they merely show which ETFs from the universe I track are falling within the guidelines specified.
————————————————————-
READER Q & A FOR THE WEEK
All Reader Q & A’s are listed at our web site!
Check it out at:
http://www.successful-investment.com/q&a.php
A note from reader Joseph:
Q: Ulli: This is more a comment than a question. I really like your 10 ETFs in the Spotlight addition, which I follow daily. I used to be the type of investor who could not be invested in too many mutual funds and/or ETFs.
I now use the spotlight ETFs as my guide, have reduced my total holdings sharply, update my trailing stops daily and have found that my investing endeavors currently not only take much less time but also have reduced my emotional decision making in the process. I am much more relaxed and feel confident that I can better handle the uncertainties of the market place. Thanks for that.
A: Joseph: While I don’t dwell on this often enough, the issues you have addressed exactly describe the main benefits of the trend tracking methodology. Having a plan in place that deals with whatever the market gives you, let’s you make better decisions and, as importantly, allows you to sleep better at night.
———————————————————-
WOULD YOU LIKE TO HAVE YOUR INVESTMENTS PROFESSIONALLY MANAGED?
Do you have the time to follow our investment plans yourself? If you are a busy professional who would like to have his portfolio managed using our methodology, please contact me directly or get more details at:
https://theetfbully.com/personal-investment-management/
———————————————————
Back issues of the ETF/No Load Fund Tracker are available on the web at:
https://theetfbully.com/newsletter-archives/