
1. Moving The Markets
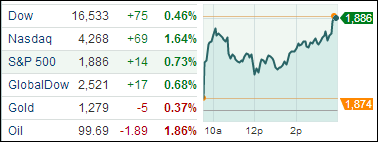
On this very April Fool’s day, domestic equities rallied for the second day in a row, powered by consumer and technology stocks, and pushed the benchmark S&P 500 to an all-time high as the chart above shows.
Optimism prevailed as the ISM index rose in March indicating that the economy may not have suffered as much as a result of the harsh winter conditions as had been assumed. Further helping upside momentum were comments from new Fed chief Yellen yesterday that monetary stimulus would be needed for “some time” due to “considerable slack” in the labor market.
That’s all it took and up we went. The S&P 500 finally managed to close above the 1,880 level after having nibbled on it several times over the past few sessions. While the month of March was a mixed bag for some areas, especially tech and small caps, the benchmark indexes SPY and RSP held up well supporting the long-term bullish trend.
Our 10 ETFs in the Spotlight headed higher with 5 of them making new highs today; 9 of them are now on the plus side YTD.
2. ETFs in the Spotlight
In case you missed the announcement and description of this section, you can read it here again.
It features 10 broadly diversified ETFs from my HighVolume list as posted every Monday. Furthermore, they are screened for the lowest MaxDD% number meaning they have been showing better resistance to temporary sell offs than all others over the past year.
In other words, none of them ever triggered their 7.5% sell stop level during this time period, which included a variety of severe market pullbacks but no move into outright bear market territory.
Here are the 10 candidates:
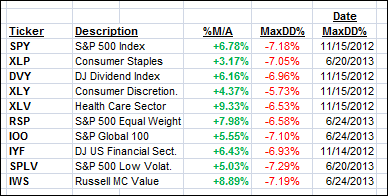
All of them are in “buy” mode meaning their prices are above their respective long term trend lines by the percentage indicated (%M/A).
Year to date, here’s how the above candidates have fared so far:
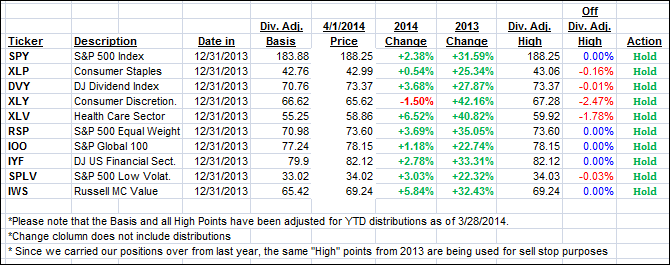
To be clear, the first table above shows the position of the various ETFs in relation to their respective long term trend lines (%M/A), while the second one tracks their trailing sell stops in the “Off High” column.
3. Domestic Trend Tracking Indexes (TTIs)
Our Trend Tracking Indexes (TTIs) moved deeper into bullish territory by the following percentages:
Domestic TTI: +3.40% (last close +2.91%)
International TTI: +4.70% (last Friday +4.02%)
Disclosure: I am obliged to inform you that I, as well as advisory clients of mine, own some of these listed ETFs. Furthermore, they do not represent a specific investment recommendation for you, they merely show which ETFs from the universe I track are falling within the guidelines specified.
Contact Ulli