ETF/No Load Fund Tracker Newsletter For May 2, 2014
ETF/No Load Fund Tracker StatSheet
————————————————————-
THE LINK TO OUR CURRENT ETF/MUTUAL FUND STATSHEET IS:
https://theetfbully.com/2014/05/weekly-statsheet-for-the-etfno-load-fund-tracker-newsletter-updated-through-05012014/
————————————————————
Market Commentary
Friday, May 2, 2014
MARKETS UP OVERALL FOR THE WEEK ON STRONG JOBS DATA
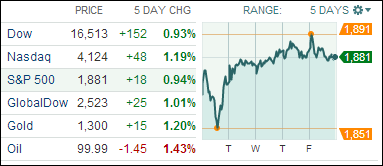
[Chart courtesy of MarketWatch.com]
1. Moving The Markets
While markets slid a bit today, all three major indexes posted gains for the week as the 5-day chart above shows. The key market driver today was the much anticipated jobs report, which revealed better-than-expected data; at least on the surface. The fact that the 2 surveys used, namely the household and establishment surveys, showed a huge divergence was conveniently overlooked.
Be that as it may, data showed U.S. job growth picked up at its fastest pace in more than two years in April, suggesting a sharp rebound in economic activity early in the second quarter. Factory orders — up a strong 1.1% for March — offered another dose of good economic news but not enough to power an earlier rally through the session’s closing bell.
Healthcare shares were among the biggest strains on the market today, including U.S. drug maker Pfizer Inc (PFE) whose shares fell 1.3% after its sweetened bid for AstraZeneca Plc (AZN) was rejected.
In Asia, Japan’s Nikkei index ticked down 0.2% to 14,457.51 and share prices fell in Singapore and Indonesia, while they rose in Malaysia, Thailand and the Philippines. The international realm is acting very unpredictable at present, especially with tensions heating up between Russia and the Ukraine.
Our 10 ETFs in the Spotlight recovered during this rebound week; none of them made new highs today but 9 of them are on the plus side YTD.
2. ETFs in the Spotlight
In case you missed the announcement and description of this section, you can read it here again.
It features 10 broadly diversified ETFs from my HighVolume list as posted every Monday. Furthermore, they are screened for the lowest MaxDD% number meaning they have been showing better resistance to temporary sell offs than all others over the past year.
In other words, none of them ever triggered their 7.5% sell stop level during this time period, which included a variety of severe market pullbacks but no move into outright bear market territory.
Here are the 10 candidates:
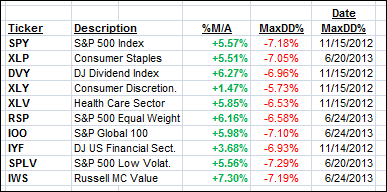
All of them are in “buy” mode, meaning their prices are above their respective long term trend lines by the percentage indicated (%M/A).
Year to date, here’s how the above candidates have fared so far:
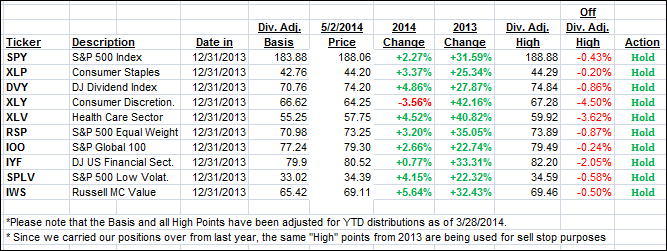
To be clear, the first table above shows the position of the various ETFs in relation to their respective long term trend lines (%M/A), while the second one tracks their trailing sell stops in the “Off High” column. The “Action” column will signal a “Sell” once the -7.5% point is taken out in the “Off High” column.
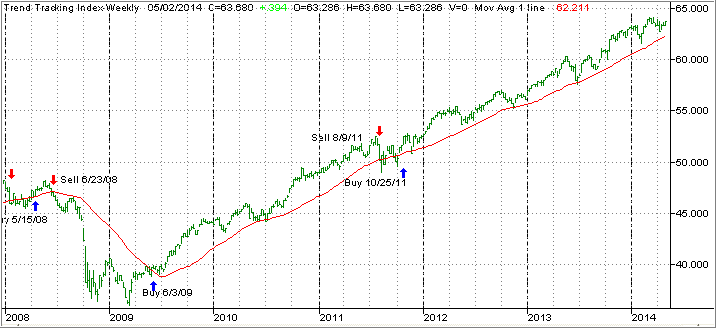
3. Domestic Trend Tracking Indexes (TTIs)
Our Trend Tracking Indexes (TTIs) bounced back and remain above their respective long-term trend lines by the following percentages:
Domestic TTI: +2.42% (last Friday +1.86%)
International TTI: +3.61% (last Friday +2.74%)
Have a great weekend.
Ulli…
Disclosure: I am obliged to inform you that I, as well as advisory clients of mine, own some of these listed ETFs. Furthermore, they do not represent a specific investment recommendation for you, they merely show which ETFs from the universe I track are falling within the guidelines specified.
————————————————————-
READER Q & A FOR THE WEEK
All Reader Q & A’s are listed at our web site!
Check it out at:
http://www.successful-investment.com/q&a.php
A note from reader Don:
Q: Ulli: When I subtract the dividend for an ETF from the high close for sell stop purposes, the sell stop is sometimes considerably less than it would be if I deducted the 7.5% from the high close. Am I right to use the high close less the dividends to compute the sell stop?
A: Don: Yes, when the price of an ETF is reduced by the amount of the dividend paid, you need to adjust the former high price by the same amount. Otherwise, your sell stop discipline is out of whack.
———————————————————-
WOULD YOU LIKE TO HAVE YOUR INVESTMENTS PROFESSIONALLY MANAGED?
Do you have the time to follow our investment plans yourself? If you are a busy professional who would like to have his portfolio managed using our methodology, please contact me directly or get more details at:
https://theetfbully.com/personal-investment-management/
———————————————————
Back issues of the ETF/No Load Fund Tracker are available on the web at:
https://theetfbully.com/newsletter-archives/