
1. Moving The Markets
The first quarter of 2014 has officially come to a close. The first three months of the year rattled investors to say the least. From tensions between Russia and the West over Ukraine and the winter storms that froze the U.S. economy in January and February. As a result, investors focused their attention on buying and holding “safe” investments, such as bonds, dividend-paying stocks, and gold. It is safe to say that, given all of the volatility, we remain in a good spot moving towards Q2.
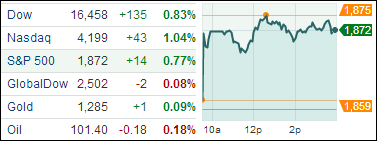
Here are the final 2014 first-quarter returns for the major U.S. stock indexes: S&P 500: +1.3%, Russell 2000: +0.8%, Nasdaq composite: +0.5%, Dow Jones Industrial Average: -0.7%.
Riskier growth-oriented stocks, particularly in biotechnology, consumer discretionary and technology stocks, fared the worst this quarter, while utility and health care stocks (i.e. dividend paying stocks) rose 9% and 5.5% respectively.
In M&A news, healthcare giant Johnson & Johnson Co. (JNJ) has accepted a $4.15 billion offer from private-equity giant Carlyle Group L.P. (CG) to acquire its Ortho-Clinical Diagnostics business. Johnson & Johnson, like other major drug makers, has been divesting non-core businesses and cutting costs amid generic competition.
Our 10 ETFs in the Spotlight rallied along with 4 of them making a new high today; 9 of them are now on the plus side YTD.
2. ETFs in the Spotlight
In case you missed the announcement and description of this section, you can read it here again.
It features 10 broadly diversified ETFs from my HighVolume list as posted every Monday. Furthermore, they are screened for the lowest MaxDD% number meaning they have been showing better resistance to temporary sell offs than all others over the past year.
In other words, none of them ever triggered their 7.5% sell stop level during this time period, which included a variety of severe market pullbacks but no move into outright bear market territory.
Here are the 10 candidates:
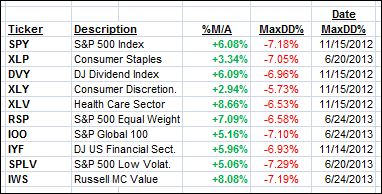
All of them are in “buy” mode meaning their prices are above their respective long term trend lines by the percentage indicated (%M/A).
Year to date, here’s how the above candidates have fared so far:
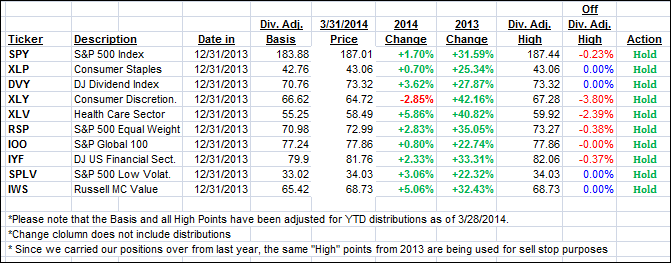
To be clear, the first table above shows the position of the various ETFs in relation to their respective long term trend lines (%M/A), while the second one tracks their trailing sell stops in the “Off High” column.
3. Domestic Trend Tracking Indexes (TTIs)
Our Trend Tracking Indexes (TTIs) headed higher and closed this volatile quarter as follows:
Domestic TTI: +2.91% (last close +2.48%)
International TTI: +4.02% (last Friday +3.37%)
Disclosure: I am obliged to inform you that I, as well as advisory clients of mine, own some of these listed ETFs. Furthermore, they do not represent a specific investment recommendation for you, they merely show which ETFs from the universe I track are falling within the guidelines specified.
Contact Ulli