ETF/No Load Fund Tracker Newsletter For January 23, 2015

Ulli ETF Tracker Contact

ETF/No Load Fund Tracker StatSheet

————————————————————-

THE LINK TO OUR CURRENT ETF/MUTUAL FUND STATSHEET IS:

https://theetfbully.com/2015/01/weekly-statsheet-for-the-etfno-load-fund-tracker-newsletter-updated-through-01222015/

————————————————————

Market Commentary

Friday, January 23, 2015

A DISAPPOINTING FINISH TO A FRUITFUL WEEK
Fri pic

[Chart courtesy of MarketWatch.com]

1. Moving the Markets

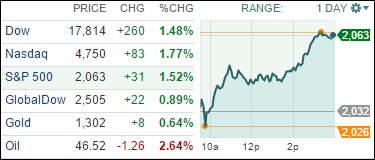
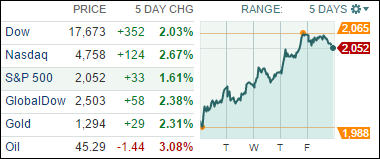
Stocks ended lower today but higher on the week, led primarily by the technology sector. Pushing markets higher in general was news from the European Central Bank. Earlier this week the ECB announced a larger-than-expected asset purchase (bond buying) program. The ECB plans to purchase at least €1.1 trillion (about $1.3 trillion) in investment-grade bonds and asset-backed securities from the secondary market, at least until September 2016. This is an attempt to spur economic growth to increase low inflation to the ECB’s 2% target.

In IPO news today, shares of online file sharing service Box (BOX) jumped more than 65% in their first day of trading. The initial price of the 12.5 million shares that were sold was set at $14 a share; however, the deal had been delayed for months. The company raised $175 million from its IPO and has clients such as General Electric (GE).

The highlight of the upcoming week will arrive on Wednesday, as the Federal Reserve FOMC two-day policy meeting ends and is followed by an announcement. The Fed has recently stated it would remain “patient” in increasing short-term policy rates as global economic growth has slowed and as inflation has stalled due to declining energy prices. Expectations are still for a midyear rate increase. Wall Street will certainly be looking for any change in the Fed’s statement.

All of our 10 ETFs in the Spotlight slipped today but most gained for the week. 6 of our funds remain on the plus side YTD as section 2 shows.
Read More

Weekly StatSheet For The ETF/No Load Fund Tracker Newsletter – Updated Through 01/22/2015

Ulli ETF StatSheet Contact

ETF/Mutual Fund Data updated through Thursday, January 22, 2015

TOC 121514

If you are not familiar with some of the terminology used, please see the Glossary of Terms.


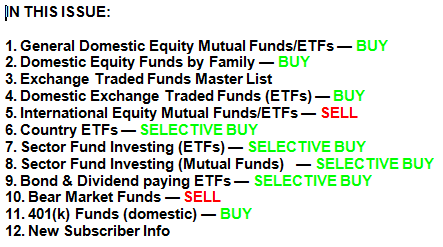
1. DOMESTIC EQUITY MUTUAL FUNDS/ETFs: BUY — since 10/22/2014

TTI

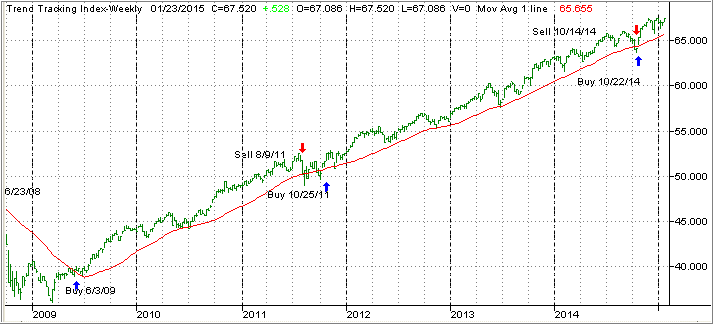
Our main directional indicator, the Domestic Trend Tracking Index (TTI), broke through its long-term trend line generating a “Sell” for this arena effective 10/14/2014, which was followed by a violent break back above the line on 10/22/14 generating a new “Buy.” It was a classic whipsaw signal, and you can read more on my blog as to the events as they were unfolding.

As of today, our TTI (green line in above chart) is positioned above its long term trend line (red) by +3.01% keeping us in the market with our established positions.

Read More

S&P 500 Ends Up On The Plus Side YTD

Ulli Market Commentary Contact

Thur pic

[Chart courtesy of MarketWatch.com]

1. Moving the Markets

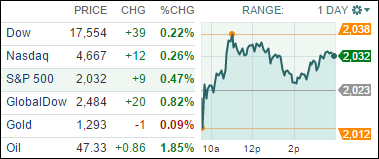
Today’s rally shifted into overdrive this afternoon as the ECB announced their widely anticipated stimulus program in form of expanded asset purchases at the tune of some $60 billion per month until at least through September 2016.

The markets were expecting a shock-and-awe type of plan, so this was good news. Whether this idea will succeed in reviving stagnant economies in the Eurozone remains to be seen or if it simply is a round-about way of bailing out indebted reform-wary governments.

On the domestic economic side, things were negative as more Americans than expected applied for unemployment benefits. Nevertheless, 8 out of 10 of the major industries in the S&P 500 advanced with financial, technology and consumer discretionary taking the lead.

All of our 10 ETFs in the Spotlight joined the party and 3 of them even made new highs for the year. 6 of them are now showing gains YTD as the table in section 2 below shows.

Read More

3rd Straight Day Of Gains

Ulli Market Commentary Contact

Wed pic

[Chart courtesy of MarketWatch.com]

1. Moving the Markets

Stocks ended higher as investors were encouraged by reports that the ECB was poised to unveil further stimulus measures. Investors on Wall Street have been looking for more aggressive measures from central banks of recent, specifically the ECB, to combat the risk of deflation and a weakening euro zone economy. Domestic stocks would benefit from a program in support of a stronger euro zone economy because Europe is one of the United States’ most important trade partners.

UnitedHealth Group (UNH) was the leading Dow component after the nation’s largest health insurer reported earnings that beat Wall Street expectations and forecast better-than-expected 2015 results. Shares jumped 3.5%.

In Media and Entertainment news, Netflix (NFLX) jumped 17% to $408 a share after the streaming and rental video company posted earnings that were above expectations. The company also said it was growing faster overseas than previously expected. On the flip side, IBM shares fell 3.1% to $152.16 today after reporting lower-than-expected revenues and giving a 2015 profit target that was below estimates. The stock was among the biggest decliners on the S&P 500.

Overseas, a big rebound in Chinese shares helped lead most Asian stock markets higher today. The Shanghai Composite surged 4.7% to 3323.61 and Hong Kong’s Hang Seng index rose 1.7% to close at 24,352.58.

All of our 10 ETFs in the Spotlight closed up with RSP leading the pack to the upside. 4 of them are now showing green numbers YTD as you can see in section 2 below.

Read More

Equities Bounce Back; China’s Slowing Growth

Ulli Market Commentary Contact

Tue pic

[Chart courtesy of MarketWatch.com]

1. Moving the Markets

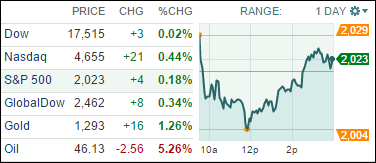
Stocks trimmed early losses on the day to close in the green. Investors shook off a mixed batch of earnings reports and concerns about global growth, while oil prices continued to tumble.

In the media entertainment world, shares of Netflix (NFLX) popped 13% on the streaming video company’s fourth quarter earnings that beat analysts’ estimates and matched revenue expectations. Netflix reported revenue of $1.48 billion and earnings of 72 cents. The company expects to hit 61.4 million members globally by the end of Q1 2015.

In economic news, the IMF lowered its forecasts for global growth over the next two years, warning Tuesday that weakness in most major economies will trump gains from lower oil prices. This may be of concern to those bullish on energy stocks in the upcoming year.

China was back in the news today. We heard today that the Chinese economy marked the slowest annual expansion in 24 years as the country steers more towards consumption-led growth. China’s gross domestic product grew 7.3% in the last quarter of 2014, and 7.4% over the whole year, the slowest rate since 1990 and below the official target of 7.5%. After years of breakneck growth, Chinese leaders including President Xi Jinping and Premier Li Keqiang now emphasize a “new normal” of slower but better quality economic growth.

6 of our 10 ETFs in the Spotlight managed to head higher while 4 of the 10 ETFs listed are now on the plus side YTD as section 2 below shows.

Read More

ETFs/Mutual Funds On The Cutline – Updated Through 1/16/2015

Ulli ETFs on the Cutline Contact

Below are the latest ETF Cutline reports, which show how far above or below their respective long-term trend lines (39 week SMA) my currently tracked ETFs/MFs are positioned.

The first report covers the ETF Master List from Thursday’s StatSheet and includes 410 ETFs, of which currently 217 (last week 237) are hovering in bullish territory.

The second report includes only High Volume ETFs. To clarify, High Volume (HV) ETFs are defined as those with an average daily volume of $10 million or higher.

These ETFs are generated from my selected list of some 97 that I use in my advisor practice. It cuts out the “noise,” which simply means it eliminates those ETFs that I would never buy because of their volume limitations. 38 ETFs (last week 34) have managed to remain in bullish territory after the recent market volatility.

The third report covers Mutual Funds on the Cutline. There are currently 223 (last week 298) above the line and 597 below it out of the 846 that I follow.

Take a look:

1. ETF Master Cutline Report

2. ETF High Volume Cutline Report

3. MF Cutline Report

In case you are not familiar with some of the terminology used in the reports, please read the Glossary of Terms.

If you missed the original post about the Cutline approach, you can read it here.