
1. Moving the Markets
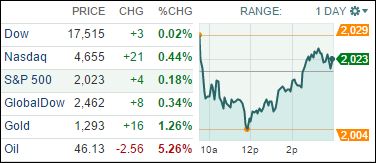
Stocks trimmed early losses on the day to close in the green. Investors shook off a mixed batch of earnings reports and concerns about global growth, while oil prices continued to tumble.
In the media entertainment world, shares of Netflix (NFLX) popped 13% on the streaming video company’s fourth quarter earnings that beat analysts’ estimates and matched revenue expectations. Netflix reported revenue of $1.48 billion and earnings of 72 cents. The company expects to hit 61.4 million members globally by the end of Q1 2015.
In economic news, the IMF lowered its forecasts for global growth over the next two years, warning Tuesday that weakness in most major economies will trump gains from lower oil prices. This may be of concern to those bullish on energy stocks in the upcoming year.
China was back in the news today. We heard today that the Chinese economy marked the slowest annual expansion in 24 years as the country steers more towards consumption-led growth. China’s gross domestic product grew 7.3% in the last quarter of 2014, and 7.4% over the whole year, the slowest rate since 1990 and below the official target of 7.5%. After years of breakneck growth, Chinese leaders including President Xi Jinping and Premier Li Keqiang now emphasize a “new normal” of slower but better quality economic growth.
6 of our 10 ETFs in the Spotlight managed to head higher while 4 of the 10 ETFs listed are now on the plus side YTD as section 2 below shows.
2. ETFs in the Spotlight
In case you missed the announcement and description of this section, you can read it here again.
It features 10 broadly diversified ETFs from my HighVolume list as posted every Monday. Furthermore, they are screened for the lowest MaxDD% number meaning they have been showing better resistance to temporary sell offs than all others over the past year.
Here are the 10 candidates:
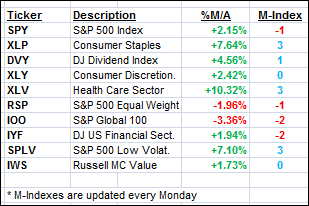
The above table simply demonstrates the magnitude with which some of the ETFs are fluctuating in regards to their positions above or below their respective individual trend lines (%M/A). A break below, represented by a negative number, shows weakness, while a break above, represented by a positive percentage, shows strength.
For more ETF/Mutual fund choices, be sure to reference Thursday’s StatSheet.
Year to date, here’s how the above candidates have fared so far:
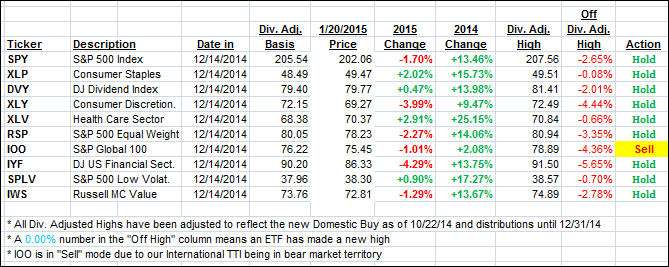
Again, the first table above shows the position of the various ETFs in relation to their respective long term trend lines (%M/A), while the second one tracks their trailing sell stops in the “Off High” column. The “Action” column will signal a “Sell” once the -7.5% point has been taken out in the “Off High” column.
3. Trend Tracking Indexes (TTIs)
Our Trend Tracking Indexes (TTIs) edged up slightly as the major indexes came off their mid-day lows and crawled above the unchanged line.
Here’s how we ended up:
Domestic TTI: +2.34% (last close +2.20%)—Buy signal since 10/22/2014
International TTI: -1.57% (last close -1.93%)—New Sell signal effective 12/15/14
Disclosure: I am obliged to inform you that I, as well as advisory clients of mine, own some of these listed ETFs. Furthermore, they do not represent a specific investment recommendation for you, they merely show which ETFs from the universe I track are falling within the guidelines specified.
Contact Ulli