
1. Moving the Markets
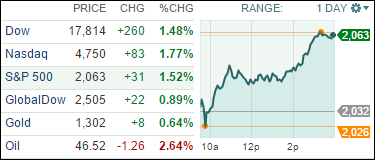
Today’s rally shifted into overdrive this afternoon as the ECB announced their widely anticipated stimulus program in form of expanded asset purchases at the tune of some $60 billion per month until at least through September 2016.
The markets were expecting a shock-and-awe type of plan, so this was good news. Whether this idea will succeed in reviving stagnant economies in the Eurozone remains to be seen or if it simply is a round-about way of bailing out indebted reform-wary governments.
On the domestic economic side, things were negative as more Americans than expected applied for unemployment benefits. Nevertheless, 8 out of 10 of the major industries in the S&P 500 advanced with financial, technology and consumer discretionary taking the lead.
All of our 10 ETFs in the Spotlight joined the party and 3 of them even made new highs for the year. 6 of them are now showing gains YTD as the table in section 2 below shows.
2. ETFs in the Spotlight
In case you missed the announcement and description of this section, you can read it here again.
It features 10 broadly diversified ETFs from my HighVolume list as posted every Monday. Furthermore, they are screened for the lowest MaxDD% number meaning they have been showing better resistance to temporary sell offs than all others over the past year.
Here are the 10 candidates:
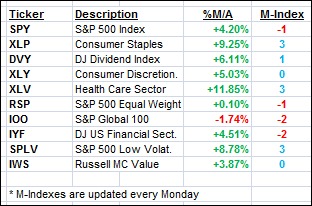
The above table simply demonstrates the magnitude with which some of the ETFs are fluctuating in regards to their positions above or below their respective individual trend lines (%M/A). A break below, represented by a negative number, shows weakness, while a break above, represented by a positive percentage, shows strength.
For more ETF/Mutual fund choices, be sure to reference Thursday’s StatSheet.
Year to date, here’s how the above candidates have fared so far:
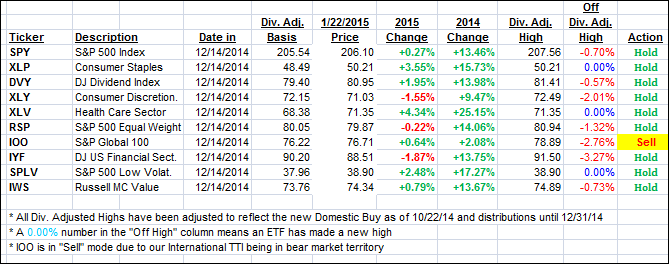
Again, the first table above shows the position of the various ETFs in relation to their respective long term trend lines (%M/A), while the second one tracks their trailing sell stops in the “Off High” column. The “Action” column will signal a “Sell” once the -7.5% point has been taken out in the “Off High” column.
3. Trend Tracking Indexes (TTIs)
Our Trend Tracking Indexes (TTIs) improved, however, the International one still remains of the bearish side of the trend line.
Here’s how we ended up:
Domestic TTI: +3.01% (last close +2.43%)—Buy signal since 10/22/2014
International TTI: -0.51% (last close -0.94%)—Sell signal effective 12/15/14
Disclosure: I am obliged to inform you that I, as well as advisory clients of mine, own some of these listed ETFs. Furthermore, they do not represent a specific investment recommendation for you, they merely show which ETFs from the universe I track are falling within the guidelines specified.
Contact Ulli