
1. Moving the Markets
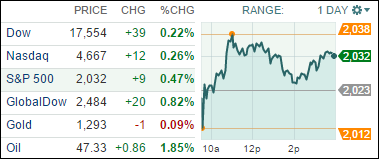
Stocks ended higher as investors were encouraged by reports that the ECB was poised to unveil further stimulus measures. Investors on Wall Street have been looking for more aggressive measures from central banks of recent, specifically the ECB, to combat the risk of deflation and a weakening euro zone economy. Domestic stocks would benefit from a program in support of a stronger euro zone economy because Europe is one of the United States’ most important trade partners.
UnitedHealth Group (UNH) was the leading Dow component after the nation’s largest health insurer reported earnings that beat Wall Street expectations and forecast better-than-expected 2015 results. Shares jumped 3.5%.
In Media and Entertainment news, Netflix (NFLX) jumped 17% to $408 a share after the streaming and rental video company posted earnings that were above expectations. The company also said it was growing faster overseas than previously expected. On the flip side, IBM shares fell 3.1% to $152.16 today after reporting lower-than-expected revenues and giving a 2015 profit target that was below estimates. The stock was among the biggest decliners on the S&P 500.
Overseas, a big rebound in Chinese shares helped lead most Asian stock markets higher today. The Shanghai Composite surged 4.7% to 3323.61 and Hong Kong’s Hang Seng index rose 1.7% to close at 24,352.58.
All of our 10 ETFs in the Spotlight closed up with RSP leading the pack to the upside. 4 of them are now showing green numbers YTD as you can see in section 2 below.
2. ETFs in the Spotlight
In case you missed the announcement and description of this section, you can read it here again.
It features 10 broadly diversified ETFs from my HighVolume list as posted every Monday. Furthermore, they are screened for the lowest MaxDD% number meaning they have been showing better resistance to temporary sell offs than all others over the past year.
Here are the 10 candidates:
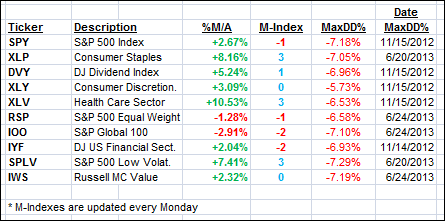
The above table simply demonstrates the magnitude with which some of the ETFs are fluctuating in regards to their positions above or below their respective individual trend lines (%M/A). A break below, represented by a negative number, shows weakness, while a break above, represented by a positive percentage, shows strength.
For more ETF/Mutual fund choices, be sure to reference Thursday’s StatSheet.
Year to date, here’s how the above candidates have fared so far:
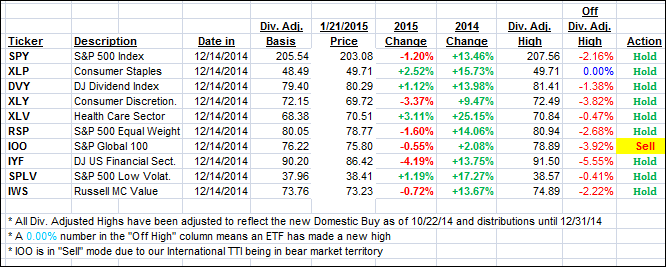
Again, the first table above shows the position of the various ETFs in relation to their respective long term trend lines (%M/A), while the second one tracks their trailing sell stops in the “Off High” column. The “Action” column will signal a “Sell” once the -7.5% point has been taken out in the “Off High” column.
3. Trend Tracking Indexes (TTIs)
Our Trend Tracking Indexes (TTIs) were mixed. Although both of them advanced, the International one showed more upward momentum, very likely in anticipation of the widely expected QE announcement by ECB’s Draghi tomorrow.
Here’s how we closed:
Domestic TTI: +2.43% (last close +2.34%)—Buy signal since 10/22/2014
International TTI: -0.94% (last close -1.57%)—Sell signal effective 12/15/14
Disclosure: I am obliged to inform you that I, as well as advisory clients of mine, own some of these listed ETFs. Furthermore, they do not represent a specific investment recommendation for you, they merely show which ETFs from the universe I track are falling within the guidelines specified.
Contact Ulli