Weekly StatSheet For The ETF/No Load Fund Tracker Newsletter – Updated Through 06/04/2015

Ulli ETF StatSheet Contact

ETF/Mutual Fund Data updated through Thursday, June 4, 2015
TOC021915

If you are not familiar with some of the terminology used, please see the Glossary of Terms.


1. DOMESTIC EQUITY MUTUAL FUNDS/ETFs: BUY — since 10/22/2014

TTI

Our main directional indicator, the Domestic Trend Tracking Index (TTI), broke through its long-term trend line generating a “Sell” for this arena effective 10/14/2014, which was followed by a violent break back above the line on 10/22/14 generating a new “Buy.” It was a classic whipsaw signal, and you can read more on my blog as to the events as they were unfolding.

As of today, our TTI (green line in above chart) is positioned above its long term trend line (red) by +1.89% keeping us in the market with our established positions.
Read More

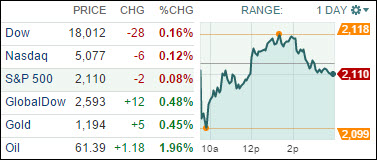
Stocks Dip Lower Amidst News From Greece

Ulli Market Commentary Contact

Thur pic

[Chart courtesy of MarketWatch.com]

1. Moving the Markets

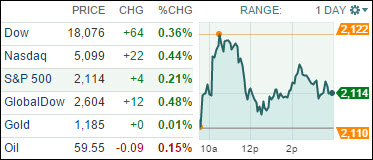
Stocks dropped sharply after Greece said it won’t make a scheduled loan repayment Friday, and the IMF lowered its U.S. economic outlook as it urged the Federal Reserve not to raise rates in 2015. Energy stocks were one of the hardest hit sectors as oil prices fell for a second day. U.S. benchmark crude fell $1.79 to $57.87 a barrel on the New York Mercantile Exchange.

Investors have been anxious about possible default and a Greek exit from the eurozone as negotiations over the debt-plagued country has dragged on for months. Greece owes its creditors — the IMF, the European Central Bank and the European Commission – a total of about 1.6 billion euros by the end of the month.

In corporate news, shares of both T-Mobile and Dish jumped after it was reported that the two companies were in merger talks. Dish (DISH) rose 4.9% and T-Mobile (TMUS) climbed 2.6%.

And, back to interest rates. Interest rate worries also continued to weigh on the markets. The International Monetary Fund said in its annual review of the U.S. economy that the Fed should wait until the first half of 2016 before raising interest rates because inflation remains too low and there are significant uncertainties as to the future resilience of economic growth.

Downward momentum accelerated today, and all of our 10 ETFs in the Spotlight slipped and closed lower. Sliding the most was the Global 100 (IOO) with a loss of 1.03%, while Healthcare (XLV) held up best by giving back only 0.69%.

Read More

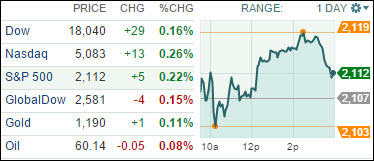
Nasdaq Flirts With Record High; U.S. Reduces Trade Deficit

Ulli Market Commentary Contact

Wed pic

[Chart courtesy of MarketWatch.com]

1. Moving the Markets

The Nasdaq made a run at its all-time closing high but fell short, though stocks still ended broadly higher on solid domestic economy news and optimism about talks over Greece’s crushing debt. For a good part of the day, the Nasdaq was riding a little above its record closing high of 5106.59, set May 27 before falling back to about 10 points shy of that threshold.

Speaking of debt, signs of improving economic conditions sent Treasury securities sliding and pushed the benchmark 10-year Treasury yield to its highest level since mid-November. The 10-year yield ended at 2.37%, up from 2.26% Tuesday.

We also heard some good news today regarding America’s trade deficit. Numbers came in from the Commerce Department that the U.S. trade deficit plunged 19.2% in April. Now at $40.9 billion, the trade gap has shrunk considerably from the previous month’s $50.6 billion. That figure marked the biggest deficit since late 2008.

And finally, Greece’s prime minister is meeting with European officials in Brussels over his country’s proposal to reach an agreement with its bailout lenders. If Greece defaults it could lead to the country leaving the euro zone.

Today, we saw 7 of our 10 ETFs in the Spotlight heading higher and 3 of them slipping a tad. The gainers were led by Consumer Discretionaries (XLY) with +0.78% while, on the downside, the iShares Select Dividend ETFs (DVY) surrendered -0.26%.

Read More

A Slow Climb; But No Gains

Ulli Market Commentary Contact

Tue pic

[Chart courtesy of MarketWatch.com]

1. Moving the Markets

Stocks recovered from early losses but closed slightly lower as Treasury yields and oil prices jumped. Investors remained uneasy as negotiations on Greece’s bailout plan continued.

It seems that investors are still keeping a fixed eye on developments in debt-plagued Greece, which faces a Friday deadline for paying the IMF 300 million euros. The payment is the first installment on a loan of 1.6 billion euros—about $1.8 billion USD.

In the zooming world of automobiles, we heard today that automakers reported a strong sales pace for the month of May. The gains were apparently helped by improved consumer confidence, lower unemployment and moderate gas prices that propelled sales of pickups and SUVs. The numbers indicate that, on an adjusted basis, the auto industry is on pace to sell almost 17.8 million new vehicles this year.

And in the world of energy, energy stocks rose as the price of oil continues to climb. The U.S. benchmark crude price was up 1.9% to $61.35 a barrel on the New York Mercantile Exchange.

Again, we had a non-directional session with 6 of our 10 ETFs in the Spotlight slipping and 4 of them managing to eke out a gain. Consumer Discretionaries (XLY) added +0.22%, while Healthcare (XLV) gave back the most by surrendering -0.65%.

Read More

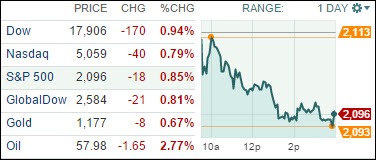
Stocks Hit The Ground Running To Kick Off June

Ulli Market Commentary Contact

Mon pic

[Chart courtesy of MarketWatch.com]

1. Moving the Markets

Stocks rose slightly as some improving economic data and a big tech deal helped Wall Street kick off the month of June on a positive note. Some M&A news gave markets a boost just before the opening bell when it was announced that Intel (INTC) said it will buy fellow chip maker Altera (ALTR) for $54 a share in an all-cash transaction valued at approximately $16.7 billion. The deal allows Intel to sell cheaper semi-custom made chips.

As for the economy, a batch of economic reports Monday showed that consumers were still pinching pennies even as the economy continued to emerge from a brutal winter. The data we saw today showed construction spending rising sharply and manufacturing activity expanding at a faster pace after a string of slowdowns. The hope was that the upturn would spill into more consumer-spending, but instead Americans are using their extra cash to pay down debt and fatten their bank accounts.

In commodities, crude oils rose to $62.15 a barrel in May, the first time the basket’s monthly price has topped $60 a barrel since last November. OPEC crude hit a low at less than $49 a barrel on March 17, and its most recent daily high was posted on May 6 at $64.96 a barrel.

It was a mixed bag today, as 8 of our 10 ETFs in the Spotlight headed higher, while 2 of them slipped and one ended unchanged. Healthcare (XLV) managed to take the lead on the upside with +0.40%; the Global 100 (IOO) slipped -0.32%.

Read More

ETFs/Mutual Funds On The Cutline – Updated Through 05/29/2015

Ulli ETFs on the Cutline Contact

Below are the latest ETF Cutline reports, which show how far above or below their respective long-term trend lines (39 week SMA) my currently tracked ETFs/MFs are positioned.

The first report covers the ETF Master List from Thursday’s StatSheet and includes 410 ETFs, of which currently 286 (last week 303) are hovering in bullish territory.

The second report includes only High Volume ETFs. To clarify, High Volume (HV) ETFs are defined as those with an average daily volume of $10 million or higher.

These ETFs are generated from my selected list of some 97 that I use in my advisor practice. It cuts out the “noise,” which simply means it eliminates those ETFs that I would never buy because of their volume limitations. 49 ETFs (last week 55) have managed to remain in bullish territory after the recent market volatility.

The third report covers Mutual Funds on the Cutline. There are currently 539 (last week 592) above the line and 281 below it out of the 820 that I follow.

Take a look:

1. ETF Master Cutline Report

2. ETF High Volume Cutline Report

3. MF Cutline Report

In case you are not familiar with some of the terminology used in the reports, please read the Glossary of Terms.

If you missed the original post about the Cutline approach, you can read it here.