
1. Moving the Markets
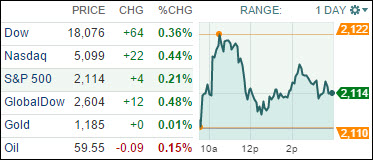
The Nasdaq made a run at its all-time closing high but fell short, though stocks still ended broadly higher on solid domestic economy news and optimism about talks over Greece’s crushing debt. For a good part of the day, the Nasdaq was riding a little above its record closing high of 5106.59, set May 27 before falling back to about 10 points shy of that threshold.
Speaking of debt, signs of improving economic conditions sent Treasury securities sliding and pushed the benchmark 10-year Treasury yield to its highest level since mid-November. The 10-year yield ended at 2.37%, up from 2.26% Tuesday.
We also heard some good news today regarding America’s trade deficit. Numbers came in from the Commerce Department that the U.S. trade deficit plunged 19.2% in April. Now at $40.9 billion, the trade gap has shrunk considerably from the previous month’s $50.6 billion. That figure marked the biggest deficit since late 2008.
And finally, Greece’s prime minister is meeting with European officials in Brussels over his country’s proposal to reach an agreement with its bailout lenders. If Greece defaults it could lead to the country leaving the euro zone.
Today, we saw 7 of our 10 ETFs in the Spotlight heading higher and 3 of them slipping a tad. The gainers were led by Consumer Discretionaries (XLY) with +0.78% while, on the downside, the iShares Select Dividend ETFs (DVY) surrendered -0.26%.
2. ETFs in the Spotlight
In case you missed the announcement and description of this section, you can read it here again.
It features 10 broadly diversified ETFs from my HighVolume list as posted every Monday. Furthermore, they are screened for the lowest MaxDD% number meaning they have been showing better resistance to temporary sell offs than all others over the past year.
Here are the 10 candidates:

The above table simply demonstrates the magnitude with which some of the ETFs are fluctuating in regards to their positions above or below their respective individual trend lines (%M/A). A break below, represented by a negative number, shows weakness, while a break above, represented by a positive percentage, shows strength.
For hundreds of ETF/Mutual fund choices, be sure to reference Thursday’s StatSheet.
Year to date, here’s how the above candidates have fared so far:

Again, the first table above shows the position of the various ETFs in relation to their respective long term trend lines (%M/A), while the second one tracks their trailing sell stops in the “Off High” column. The “Action” column will signal a “Sell” once the -7.5% point has been taken out in the “Off High” column.
3. Trend Tracking Indexes (TTIs)
For the third day in a row, our Trend Tracking Indexes (TTIs) changed only slightly as the markets remained stuck in a sideways pattern. Here’s how we closed:
Domestic TTI: +2.28% (last close +2.20%)—Buy signal effective 10/22/2014
International TTI: +4.53% (last close +4.18%)—Buy signal effective 2/13/2015
Disclosure: I am obliged to inform you that I, as well as advisory clients of mine, own some of these listed ETFs. Furthermore, they do not represent a specific investment recommendation for you, they merely show which ETFs from the universe I track are falling within the guidelines specified.
Contact Ulli