Three Down Days In A Row

Ulli Market Commentary Contact

Mon pic

[Chart courtesy of MarketWatch.com]

1. Moving the Markets

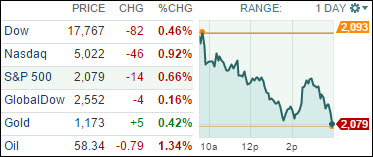
Last week’s slide continued as the major indexes headed south again, and even the last hour’s rebound attempt had no staying power, so we closed at the day’s lows.

We’re stuck in a slump with the Dow now having dipped into negative territory year-to-date, while the S&P 500 has come off its May 21st high by more than 2%. I think we’re seeing the fallout from last week’s positive jobs report, which has brought a rate increase by the Fed back into the picture. Based on this reaction, it seems that Wall Street would rather have lower rates than a stronger economy.

A new driver is needed to push the indexes out of the doldrums. On the horizon lurks Thursday’s retail sales report, which could confirm a more solid economy should it exceed expectations. If it turns out weaker than expected, we may very well see a rebound rally.

With today’s broad retreat, it was no surprise that all of our 10 ETFs in the Spotlight headed down that slippery slope and closed lower. Giving back the most was Consumer Consumer Discretionaries (XLY) with -0.71%, while Consumer Staples (XLP) held up best with a minor loss of 0.04%.

Read More

ETFs/Mutual Funds On The Cutline – Updated Through 06/05/2015

Ulli ETFs on the Cutline Contact

Below are the latest ETF Cutline reports, which show how far above or below their respective long-term trend lines (39 week SMA) my currently tracked ETFs/MFs are positioned.

The first report covers the ETF Master List from Thursday’s StatSheet and includes 410 ETFs, of which currently 247 (last week 286) are hovering in bullish territory.

The second report includes only High Volume ETFs. To clarify, High Volume (HV) ETFs are defined as those with an average daily volume of $10 million or higher.

These ETFs are generated from my selected list of some 97 that I use in my advisor practice. It cuts out the “noise,” which simply means it eliminates those ETFs that I would never buy because of their volume limitations. 41 ETFs (last week 49) have managed to remain in bullish territory after the recent market volatility.

The third report covers Mutual Funds on the Cutline. There are currently 513 (last week 539) above the line and 307 below it out of the 820 that I follow.

Take a look:

1. ETF Master Cutline Report

2. ETF High Volume Cutline Report

3. MF Cutline Report

In case you are not familiar with some of the terminology used in the reports, please read the Glossary of Terms.

If you missed the original post about the Cutline approach, you can read it here.

One Man’s Opinion: Does The US Labor Market Data Indicate Stronger GDP Growth?

Ulli Market Review Contact

ManThe latest nonfarm payrolls data showed the US economy added 280,000 jobs in May, which reassures investors that the jobs trend is clearly above 200,000 gains per month, said Jan Hatzius, chief economist at Goldman Sachs.

There was some doubt after March’s very weak employment report – the economy added only 85,000 jobs for the month, before the upward revision came in Friday. Also, April’s reading of 223,000 raised the question whether the jobs growth trend weakened to less than 200,000. But with May’s number, investors’ can lay that concern to rest as the trend is clearly above 200,000, he noted.

While the jobs report show solid improvement, consumer spending data has continued to disappoint. Asked to explain this disconnect, Jan said labor market data and generally the survey data has also been better than retails sales, and ultimately GDP data because retail sales is the most important input and contributes nearly 70 percent to US GDP. The GDP data has been weaker than the general message conveyed by the other parts of economic-data universe. It would prudent to put more weight on labor market numbers and the surveys because there are likely to be less measurement errors in those than GDP numbers, he explained.

Read More

New ETFs On The Block: Innovator IBD 50 Fund (FFTY)

Ulli Equity ETFs Contact

Financial DataGeopolitics has taken precedence over economics in the past few months, thus stoking uncertainty and volatility across asset classes. European Central Bank President Mario Draghi’s latest statement this week that investors should prepare for higher market volatility underscores this new reality and calls for better protection for possible downsides.

Actively managed exchange-traded funds tend to perform well during uncertain times as fund managers regularly make necessary changes in a rapidly changing environment based on investors’ risk-reward profile.

Amid all the noise involving the US economy, New York-based Innovator Management recently launched the Innovator IBD 50 Fund (FFTY) ETF to give investors’ access in IBD’s proprietary investment strategy. Financial publication Investor’s Business Daily (IBD) has been compiling and preparing for decades a list of 50 stocks under the so-called IBD 50 heading and rating them based on relative strength.

Read More

06-05-2015

Ulli Newsletter Archives Contact

ETF/No Load Fund Tracker Newsletter For June 5, 2015

ETF/No Load Fund Tracker StatSheet

————————————————————-

THE LINK TO OUR CURRENT ETF/MUTUAL FUND STATSHEET IS:

https://theetfbully.com/2015/06/weekly-statsheet-for-the-etfno-load-fund-tracker-newsletter-updated-through-06042015/

————————————————————

Market Commentary

STOCKS NOT PERFORMING DESPITE SOLID ECONOMIC DATA

Fri pic

[Chart courtesy of MarketWatch.com]

1. Moving the Markets

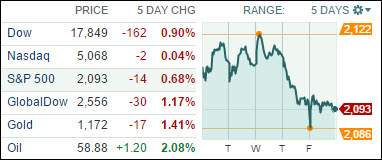
Stocks finished the week slightly lower despite a solid employment report on Friday. Concerns surrounding Greece continued after a decision to delay repayment of an International Monetary Fund loan. Additionally, the better-than-expected jobs growth continued to drive speculation around a potential hike in interest rates by the Federal Reserve later in 2015. While many analysts believe interest rate increases are likely in the future, they still can’t predict when and how fast they will rise.

It was a good week for economic numbers. Following another winter slowdown, job growth picked up in May as the economy created 280,000 jobs. That was better than the expected gain of 226,000 according to Bloomberg. The unemployment rate edged higher to 5.5%, largely due to more people entering the job market, which is another sign of improvement. And wages rose 2.3% over the past year, the fastest growth since August 2013.

Crude oil settled up $1.13 or 1.95% to $59.13 a barrel. Oil fluctuated around its starting price for much of the day after initially spiking on news OPEC will maintain output at 30 million barrels per day for another six months, keeping a glut in markets.

In tech, we heard a new report today that Twitter (TWTR) announced a secondary offering from existing shareholders. The number of shares up for sale is anticipated to be around 10.4 million.

Next week, retail sales will be announced on Thursday, and the Producer Price Index and University of Michigan Consumer Sentiment Index are scheduled for release on Friday.

9 of our 10 ETFs in the Spotlight continued to slide today, while one of them bucked the trend. The lonely winner was the Financials (IYF) with a gain of 0.38%. On the downside, Consumer Staples led with a loss of 1.43%.

2. ETFs in the Spotlight

In case you missed the announcement and description of this section, you can read it here again.

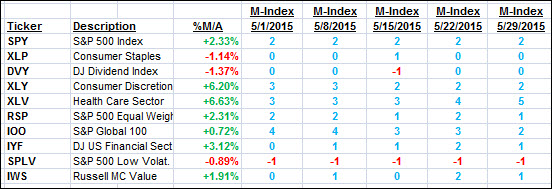
It features 10 broadly diversified ETFs from my HighVolume list as posted every Monday. Furthermore, they are screened for the lowest MaxDD% number meaning they have been showing better resistance to temporary sell offs than all others over the past year.

Here are the 10 candidates:
MaxDD

The above table simply demonstrates the magnitude with which some of the ETFs are fluctuating in regards to their positions above or below their respective individual trend lines (%M/A). A break below, represented by a negative number, shows weakness, while a break above, represented by a positive percentage, shows strength.

For hundreds of ETF/Mutual fund choices, be sure to reference Thursday’s StatSheet.

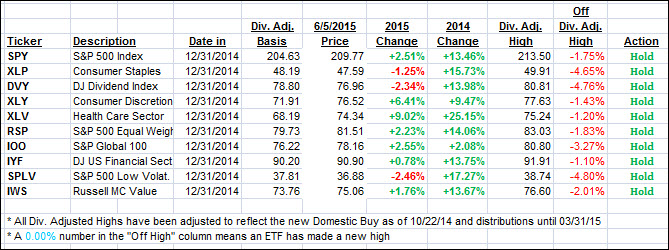
Year to date, here’s how the above candidates have fared so far:
YTD

Again, the first table above shows the position of the various ETFs in relation to their respective long term trend lines (%M/A), while the second one tracks their trailing sell stops in the “Off High” column. The “Action” column will signal a “Sell” once the -7.5% point has been taken out in the “Off High” column.

3. Trend Tracking Indexes (TTIs)

Our Trend Tracking Indexes (TTIs) retreated with the major indexes but remain bullish. Here’s how we ended this week:

Domestic TTI: +1.70% (last Friday +2.27%)—Buy signal effective 10/22/2014

International TTI: +3.21% (last Friday +4.07%)—Buy signal effective 2/13/2015

Have a nice weekend.

Ulli…

Disclosure: I am obliged to inform you that I, as well as advisory clients of mine, own some of these listed ETFs. Furthermore, they do not represent a specific investment recommendation for you, they merely show which ETFs from the universe I track are falling within the guidelines specified.

————————————————————-

READER Q & A FOR THE WEEK

Reader Chris:

Q: Ulli: Quick question regarding your opinion if/when Greece leaves the EU, could it make the Euro much stronger and in doing so negatively impact the IOO’s ETF performance?

A: Chris: There are many possible scenarios with Greece leaving the Euro. If it’s an ugly divorce and the EU has to swallow the losses of the unpaid loans, which is very likely, then the contagion could spread to the peripheral countries like Portugal, Spain and Italy. Eventually, it will mean the demise of the Euro as we know it, but the timing is unknown. However, if the Euro crumbles, the dollar will rally, and we’ll have to wait and see how domestic equities will be affected.

Keep in mind that we are in uncharted territory with this situation, and no one really has a clue how this will play out. One thing is for sure that you are better off having an exit strategy in place, because things could get ugly in a hurry, and there will be no place to hide except on the sidelines. If you are holding IOO (I don’t), you don’t have to panic; simply follow the trailing sell stop discipline and execute when the market tells you it’s time to do so. That will eliminate any guesswork or having to listen to predictions by others who don’t know either what the future will bring.

Hope this helps.

All Reader Q & A’s are listed at our web site!
Check it out at:

http://www.successful-investment.com/q&a.php

———————————————————-

WOULD YOU LIKE TO HAVE YOUR INVESTMENTS PROFESSIONALLY MANAGED?

Do you have the time to follow our investment plans yourself? If you are a busy professional who would like to have his portfolio managed using our methodology, please contact me directly or get more details at:

https://theetfbully.com/personal-investment-management/

———————————————————

Back issues of the ETF/No Load Fund Tracker are available on the web at:

https://theetfbully.com/newsletter-archives/

ETF/No Load Fund Tracker Newsletter For June 5, 2015

Ulli ETF Tracker Contact

ETF/No Load Fund Tracker StatSheet

————————————————————-

THE LINK TO OUR CURRENT ETF/MUTUAL FUND STATSHEET IS:

https://theetfbully.com/2015/06/weekly-statsheet-for-the-etfno-load-fund-tracker-newsletter-updated-through-06042015/

————————————————————

Market Commentary

STOCKS NOT PERFORMING DESPITE SOLID ECONOMIC DATA

Fri pic

[Chart courtesy of MarketWatch.com]

1. Moving the Markets

Stocks finished the week slightly lower despite a solid employment report on Friday. Concerns surrounding Greece continued after a decision to delay repayment of an International Monetary Fund loan. Additionally, the better-than-expected jobs growth continued to drive speculation around a potential hike in interest rates by the Federal Reserve later in 2015. While many analysts believe interest rate increases are likely in the future, they still can’t predict when and how fast they will rise.

It was a good week for economic numbers. Following another winter slowdown, job growth picked up in May as the economy created 280,000 jobs. That was better than the expected gain of 226,000 according to Bloomberg. The unemployment rate edged higher to 5.5%, largely due to more people entering the job market, which is another sign of improvement. And wages rose 2.3% over the past year, the fastest growth since August 2013.

Crude oil settled up $1.13 or 1.95% to $59.13 a barrel. Oil fluctuated around its starting price for much of the day after initially spiking on news OPEC will maintain output at 30 million barrels per day for another six months, keeping a glut in markets.

In tech, we heard a new report today that Twitter (TWTR) announced a secondary offering from existing shareholders. The number of shares up for sale is anticipated to be around 10.4 million.

Next week, retail sales will be announced on Thursday, and the Producer Price Index and University of Michigan Consumer Sentiment Index are scheduled for release on Friday.

9 of our 10 ETFs in the Spotlight continued to slide today, while one of them bucked the trend. The lonely winner was the Financials (IYF) with a gain of 0.38%. On the downside, Consumer Staples led with a loss of 1.43%.

Read More