
1. Moving the Markets
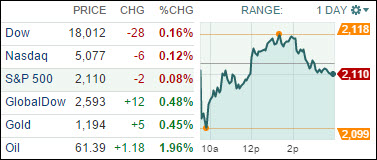
Stocks recovered from early losses but closed slightly lower as Treasury yields and oil prices jumped. Investors remained uneasy as negotiations on Greece’s bailout plan continued.
It seems that investors are still keeping a fixed eye on developments in debt-plagued Greece, which faces a Friday deadline for paying the IMF 300 million euros. The payment is the first installment on a loan of 1.6 billion euros—about $1.8 billion USD.
In the zooming world of automobiles, we heard today that automakers reported a strong sales pace for the month of May. The gains were apparently helped by improved consumer confidence, lower unemployment and moderate gas prices that propelled sales of pickups and SUVs. The numbers indicate that, on an adjusted basis, the auto industry is on pace to sell almost 17.8 million new vehicles this year.
And in the world of energy, energy stocks rose as the price of oil continues to climb. The U.S. benchmark crude price was up 1.9% to $61.35 a barrel on the New York Mercantile Exchange.
Again, we had a non-directional session with 6 of our 10 ETFs in the Spotlight slipping and 4 of them managing to eke out a gain. Consumer Discretionaries (XLY) added +0.22%, while Healthcare (XLV) gave back the most by surrendering -0.65%.
2. ETFs in the Spotlight
In case you missed the announcement and description of this section, you can read it here again.
It features 10 broadly diversified ETFs from my HighVolume list as posted every Monday. Furthermore, they are screened for the lowest MaxDD% number meaning they have been showing better resistance to temporary sell offs than all others over the past year.
Here are the 10 candidates:
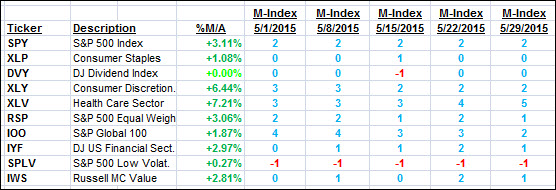
The above table simply demonstrates the magnitude with which some of the ETFs are fluctuating in regards to their positions above or below their respective individual trend lines (%M/A). A break below, represented by a negative number, shows weakness, while a break above, represented by a positive percentage, shows strength.
For hundreds of ETF/Mutual fund choices, be sure to reference Thursday’s StatSheet.
Year to date, here’s how the above candidates have fared so far:
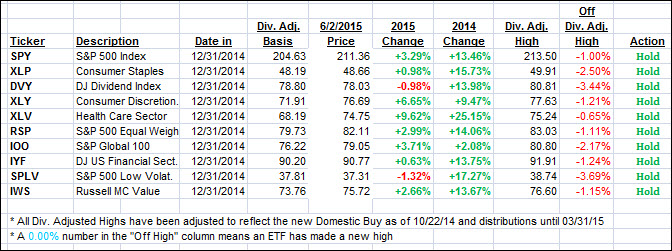
Again, the first table above shows the position of the various ETFs in relation to their respective long term trend lines (%M/A), while the second one tracks their trailing sell stops in the “Off High” column. The “Action” column will signal a “Sell” once the -7.5% point has been taken out in the “Off High” column.
3. Trend Tracking Indexes (TTIs)
In a repeat performance from yesterday, our Trend Tracking Indexes (TTIs) changed only slightly as the markets meandered aimlessly. Here’s how we ended up:
Domestic TTI: +2.20% (last close +2.28)—Buy signal effective 10/22/2014
International TTI: +4.18% (last close +3.93%)—Buy signal effective 2/13/2015
Disclosure: I am obliged to inform you that I, as well as advisory clients of mine, own some of these listed ETFs. Furthermore, they do not represent a specific investment recommendation for you, they merely show which ETFs from the universe I track are falling within the guidelines specified.
Contact Ulli