Weekly StatSheet For The ETF/No Load Fund Tracker Newsletter – Updated Through 06/25/2015

Ulli ETF StatSheet Contact

ETF/Mutual Fund Data updated through Thursday, June 25, 2015
TOC021915

If you are not familiar with some of the terminology used, please see the Glossary of Terms.


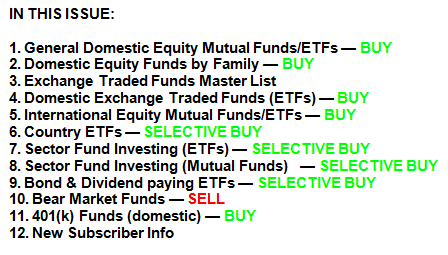
1. DOMESTIC EQUITY MUTUAL FUNDS/ETFs: BUY — since 10/22/2014

TTI

Our main directional indicator, the Domestic Trend Tracking Index (TTI), broke through its long-term trend line generating a “Sell” for this arena effective 10/14/2014, which was followed by a violent break back above the line on 10/22/14 generating a new “Buy.” It was a classic whipsaw signal, and you can read more on my blog as to the events as they were unfolding.

As of today, our TTI (green line in above chart) is positioned above its long term trend line (red) by +1.86% keeping us in the market with our established positions.
Read More

Greece And Economic Data Pull Indexes Down

Ulli Market Commentary Contact

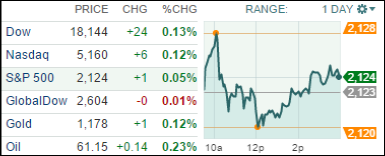
Thur pic

[Chart courtesy of MarketWatch.com]

1. Moving the Markets

The early move to the upside turned into a dud when the usual culprits, namely Greece and the domestic economy, combined forces that gave the bear the upper hand for this session.

Also weighing on market sentiment was the miserable performance of the Dow Transportation Index, which is now down some 10% from its peak reached in late November. This index is often viewed as representative of the state of the economy.

Domestically, consumer spending shot up sharply showing the biggest gain in some 6 years and jobless claims remained at a decade low. Some of the economic reports of the recent past have shown improvement, which these days is a bad thing as it increases the chances of the Fed raising rates sooner than hoped for.

Meanwhile, it should be no surprise to you that the Greek soap opera continues with all its nuances. A Thursday morning meeting failed to generate consensus, so we’re back to square one.

9 of our 10 ETFs in the Spotlight headed south and closed lower with the Financials (IYF) suffering the most by losing 0.71%. Bucking the trend was our YTD winner, Healthcare (XLV), which managed to eke out a 0.55% gain.

Read More

A Slippery Back Diamond Slope

Ulli Market Commentary Contact

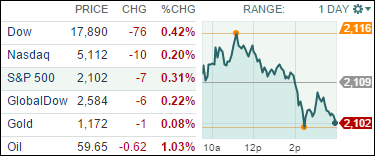
Wed pic

[Chart courtesy of MarketWatch.com]

1. Moving the Markets

After two days of gains, it was time for a reversal. To no surprise, the culprit turned out to be another failed set of negotiations between Greece and its EU creditors. It was the Greek headlines that moved the markets to the downside, as disappointment over progress prevailed. Another meeting was scheduled for tonight…

The domestic news featured the revised GDP number for the 4th quarter to only -0.2% from a previous -0.7%, which was in line with expectations. On the earnings front, home builder Lennar (LEN) reported better than expected second quarter earnings pushing its share price up by 3.8%.

All of our 10 ETFs in the Spotlight joined the market pullback and closed lower. Holding up the best was Consumer Staples (XLP), which gave back 0.45%. The most volatility was seen in the Global 100 (IOO) as it surrendered 2.40%.

Read More

Edging Up On Low Volume

Ulli Market Commentary Contact

Tue pic

[Chart courtesy of MarketWatch.com]

1. Moving the Markets

Gains are better then losses; even if they’re small! That was the case today as the major indexes hugged the unchanged line but managed to close on the plus side. The Nasdaq eked out another record as the waiting game in the Greek saga continues. More clarification is needed to see if the latest proposal to the creditors can be nailed down.

To me, it looks like the markets have priced in some kind of acceptable resolution but, of course, you can never be sure of the actual outcome. Right now the game goes on, and it will be interesting to see what market reaction will be should Greece end up leaving the EU. In my view, the impact on the domestic market may not be that great but for sure the euro and the dollar, along with European stocks, will most likely be severly affected.

Our 10 ETFs in the Spotlight were mixed as the indexes meandered without clear direction. Nevertheless, 5 of them gained with the leader being the Consumer Discretionaries (XLY) with +0.40%, while the downside was led by Consumer Staples (XLP) with -0.43%.

Read More

Greek Optimism Pushes Indexes Higher

Ulli Market Commentary Contact

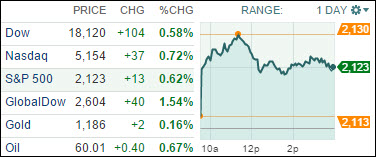
Mon pic

[Chart courtesy of MarketWatch.com]

1. Moving the Markets

The bulls were in charge race right after the opening, and the major indexes shifted into rally mode closing on the plus side with the Nasdaq making a new record high. Despite the pullback during mid-day, we closed solidly above the unchanged line.

The driving forces, as has been the case lately, are the negotiations in Greece where new reform proposals were presented but caution remained as to the feasibility. That means it will take a few more agonizing days of deliberation along with the usual menu of accusations before any determination can be made if the primary issues have really been addressed and resolved. In other words, the Greek saga goes on…

Overall market sentiment was positive due to merger and acquisition activity in the energy field and a report that existing home sales not only grew more than expected but also surged to their highest level in over 5 years.

All of our 10 ETFs in the Spotlight picked up speed and closed up. The leader for the day was the Global 100 (IOO) with a gain of +1.22%, while the MC Value (IWS) was lagging but added 0.28%.

Read More

ETFs/Mutual Funds On The Cutline – Updated Through 06/19/2015

Ulli ETFs on the Cutline Contact

Below are the latest ETF Cutline reports, which show how far above or below their respective long-term trend lines (39 week SMA) my currently tracked ETFs/MFs are positioned.

The first report covers the ETF Master List from Thursday’s StatSheet and includes 410 ETFs, of which currently 267 (last week 260) are hovering in bullish territory.

The second report includes only High Volume ETFs. To clarify, High Volume (HV) ETFs are defined as those with an average daily volume of $10 million or higher.

These ETFs are generated from my selected list of some 97 that I use in my advisor practice. It cuts out the “noise,” which simply means it eliminates those ETFs that I would never buy because of their volume limitations. 47 ETFs (last week 43) have managed to remain in bullish territory after the recent market volatility.

The third report covers Mutual Funds on the Cutline. There are currently 578 (last week 533) above the line and 242 below it out of the 820 that I follow.

Take a look:

1. ETF Master Cutline Report

2. ETF High Volume Cutline Report

3. MF Cutline Report

In case you are not familiar with some of the terminology used in the reports, please read the Glossary of Terms.

If you missed the original post about the Cutline approach, you can read it here.