Weekly StatSheet For The ETF/No Load Fund Tracker Newsletter – Updated Through 07/09/2015

Ulli ETF StatSheet Contact

ETF/Mutual Fund Data updated through Thursday, July 9, 2015

TOC021915

If you are not familiar with some of the terminology used, please see the Glossary of Terms.


1. DOMESTIC EQUITY MUTUAL FUNDS/ETFs: BUY — since 10/22/2014

TTI

Our main directional indicator, the Domestic Trend Tracking Index (TTI), broke through its long-term trend line generating a “Sell” for this arena effective 10/14/2014, which was followed by a violent break back above the line on 10/22/14 generating a new “Buy.” It was a classic whipsaw signal, and you can read more on my blog as to the events as they were unfolding.

As of today, our TTI (green line in above chart) is positioned above its long term trend line (red) by +0.38% keeping us in the market with our established positions.

Read More

A Great Beginning Followed By A Poor Ending

Ulli Market Commentary Contact

Thur pic

[Chart courtesy of MarketWatch.com]

1. Moving the Markets

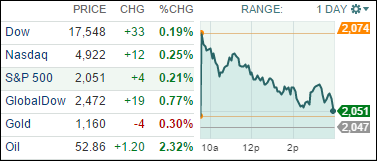
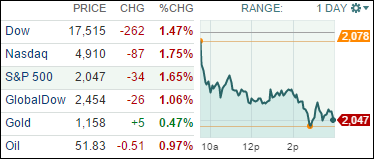
The indexes raced out of the starting blocks with the S&P 500 shooting up 27 points as China’s efforts of stemming their market slide seemed to be successful—at least for the time being. Of course, as we all know, it’s very questionable as to whether these manipulative attempts, including harsh penalties for short sellers (that’s not a joke), have any long lasting effect. But, it’s central planning at its finest.

However, it gave worldwide markets some relief, but domestically, the rally faded all day and into the close, but we managed to stay above the unchanged line by a fraction.

Lending some support was renewed hope out of Europe that Greece might be able to wing some kind of deal, which would keep its membership in the EU intact. Well, we have heard many of those types of stories and until I see it, I won’t believe it. Nevertheless, the European markets also managed to close up pushing the International Trend Tracking Index (TTI) to within shouting distance of breaking back above its long term trend line (section 3 below).

9 of our 10 ETFs in the Spotlight participated in the rebound and closed higher. Heading the gainers was the Global 100 (IOO) with +0.64%, while the only loser of the day was the Dividend ETF (DVY), which gave back -0.18%.

Read More

Equities Tumble—The International TTI Slips Into Bear Market Territory

Ulli Market Commentary Contact

Wed pic

[Chart courtesy of MarketWatch.com]

1. Moving the Markets

For a change, at least on Wall Street, the problems in Greece seemed to have moved to the back-burner, while issues in China, such as their over 30% stock market slide in the past 3 weeks took center stage. The concern is that China’s equity slide will hurt their economy, the second largest in the world, and there will be more potential spillover risks from that fallout.

Unfortunately, yesterday’s dead cat bounce was confirmed as all gains were given back putting the S&P below its widely followed 200-day moving average. Souring the mood even further was a 3-1/2 hour malfunction of the New York Stock Exchange, followed by the Wall Street Journal going offline and United Airlines experiencing a computer glitch, which grounded their fleet of airplanes.

Then the FOMC released their minutes casting more uncertainty as to whether the economy was sufficiently strong to absorb a planned raise in interest rates. They did acknowledge, however, that uncertainty exists in regards to the pace of economic growth abroad and the open question as to whether Greece and its creditors would reach an agreement.

It was a day to forget; what matters to us is whether the current bullish trend can be sustained or not. Take a look at section 3 below to see how our Trend Tracking Indexes (TTIs) were affected by today’s session.

All of our 10 ETFs in the Spotlight succumbed to the bears and closed lower headed to the downside by Consumer Discretionaries (XLY) with -1.90%, while Consumer Staples (XLP) gave back the least but still surrendered -1.12%.

Read More

Hope Of A Solution In Greece Fuels Rebound

Ulli Market Commentary Contact

Tue pic

[Chart courtesy of MarketWatch.com]

1. Moving the Markets

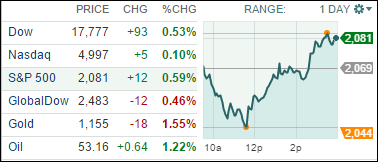
Things looked very dicey for the S&P 500, and the markets in general, as the indexes dropped sharply after the opening. The S&P touched the 2,044 level, which was a break below its widely followed 200-day moving average.

A close around the lows of the day may have generated a “Sell” signal for domestic equity funds/ETFs, but the Greek PM came to the rescue by proposing some interim financing until the end of July.

That was all it took, and the hope rally, which at this point looks like a giant dead cat bounce, shifted into high gear with the indexes staging an amazing turnaround as the S&P sported an intra-day range of 37 points. As I mentioned before, volatility is here to stay a while longer until the mess in Greece gets sorted out—one way or another.

All of our 10 ETFs in the Spotlight participated and closed up with Consumer Staples (XLP) leading the charge at +2.06%, while the Financials (IYF) lagged with a more modest gain of 0.18%.

Read More

Equities Pull Back As Outlook For Greece Remains Uncertain

Ulli Market Commentary Contact

Mon pic

[Chart courtesy of MarketWatch.com]

1. Moving the Markets

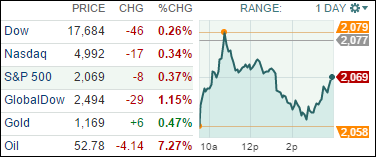
It was a roller coaster ride as the major indexes dropped at the open, then managed to climb above the unchanged line before slipping again but rallying into the close.

So far, the fallout has been worse in Europe but uncertainty and subsequent volatility may stay with us for a while. Via Sunday’s referendum, Greece essentially divorced itself from the current bailout terms, but we are in uncharted territory here, so there is no precedent as to the next steps involved.

The whipping boy of the day was oil, which got spanked and lost over 7% as the chart above shows. It is certain that the Greece story will remain in the headlines and will further affect world markets. The degree of any potential fallout is unknown, but to us, following the major trends in the markets, the only thing that matters is whether this current uptrend is sustained or not. Be sure to tune in regularly to watch the Trend Tracking Indexes (TTI) in section 3 below to see if any Sell signals are being generated.

All of our 10 ETFs in the Spotlight retreated moderately with the Global 100 (IOO) taking the lead to the downside with -1.15%, while Consumer Staples (XLP) held up best by giving back only -0.08%.

Read More

ETFs/Mutual Funds On The Cutline – Updated Through 07/02/2015

Ulli ETFs on the Cutline Contact

Below are the latest ETF Cutline reports, which show how far above or below their respective long-term trend lines (39 week SMA) my currently tracked ETFs/MFs are positioned.

The first report covers the ETF Master List from Thursday’s StatSheet and includes 410 ETFs, of which currently 195 (last week 240) are hovering in bullish territory.

The second report includes only High Volume ETFs. To clarify, High Volume (HV) ETFs are defined as those with an average daily volume of $10 million or higher.

These ETFs are generated from my selected list of some 97 that I use in my advisor practice. It cuts out the “noise,” which simply means it eliminates those ETFs that I would never buy because of their volume limitations. 31 ETFs (last week 35) have managed to remain in bullish territory after the recent market volatility.

The third report covers Mutual Funds on the Cutline. There are currently 418 (last week 539) above the line and 402 below it out of the 820 that I follow.

Take a look:

1. ETF Master Cutline Report

2. ETF High Volume Cutline Report

3. MF Cutline Report

In case you are not familiar with some of the terminology used in the reports, please read the Glossary of Terms.

If you missed the original post about the Cutline approach, you can read it here.