
1. Moving the Markets
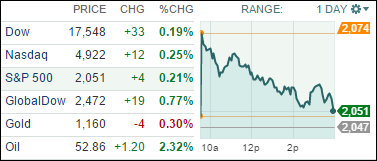
The indexes raced out of the starting blocks with the S&P 500 shooting up 27 points as China’s efforts of stemming their market slide seemed to be successful—at least for the time being. Of course, as we all know, it’s very questionable as to whether these manipulative attempts, including harsh penalties for short sellers (that’s not a joke), have any long lasting effect. But, it’s central planning at its finest.
However, it gave worldwide markets some relief, but domestically, the rally faded all day and into the close, but we managed to stay above the unchanged line by a fraction.
Lending some support was renewed hope out of Europe that Greece might be able to wing some kind of deal, which would keep its membership in the EU intact. Well, we have heard many of those types of stories and until I see it, I won’t believe it. Nevertheless, the European markets also managed to close up pushing the International Trend Tracking Index (TTI) to within shouting distance of breaking back above its long term trend line (section 3 below).
9 of our 10 ETFs in the Spotlight participated in the rebound and closed higher. Heading the gainers was the Global 100 (IOO) with +0.64%, while the only loser of the day was the Dividend ETF (DVY), which gave back -0.18%.
2. ETFs in the Spotlight
In case you missed the announcement and description of this section, you can read it here again.
It features 10 broadly diversified ETFs from my HighVolume list as posted every Monday. Furthermore, they are screened for the lowest MaxDD% number meaning they have been showing better resistance to temporary sell offs than all others over the past year.
Here are the 10 candidates:
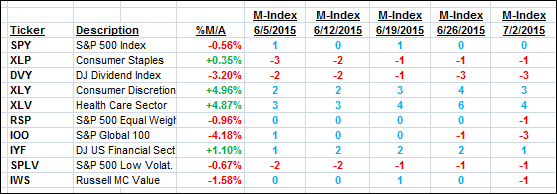
The above table simply demonstrates the magnitude with which some of the ETFs are fluctuating in regards to their positions above or below their respective individual trend lines (%M/A). A break below, represented by a negative number, shows weakness, while a break above, represented by a positive percentage, shows strength.
For hundreds of ETF/Mutual fund choices, be sure to reference Thursday’s StatSheet.
Year to date, here’s how the above candidates have fared so far:
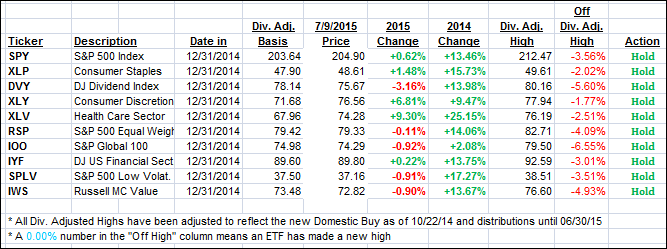
Again, the first table above shows the position of the various ETFs in relation to their respective long term trend lines (%M/A), while the second one tracks their trailing sell stops in the “Off High” column. The “Action” column will signal a “Sell” once the -7.5% point has been taken out in the “Off High” column.
3. Trend Tracking Indexes (TTIs)
Our Trend Tracking Indexes (TTIs) improved with the International one moving into close proximity of breaking its long term trend line to the upside again.
Here’s how we closed:
Domestic TTI: +0.38% (last close +0.35%)—Buy signal effective 10/22/2014
International TTI: -0.16% (last close -1.01%)—Buy signal effective 2/13/2015
Disclosure: I am obliged to inform you that I, as well as advisory clients of mine, own some of these listed ETFs. Furthermore, they do not represent a specific investment recommendation for you, they merely show which ETFs from the universe I track are falling within the guidelines specified.
Contact Ulli