Do you want to know which ETFs are hot and which ones are not? Then you need my High-Volume ETF Cutline report. It tells you how close or far each of the 311 ETFs I follow is from its long-term trend line (39-week SMA). These are the ETFs that trade more than $5 million a day, so they are not some obscure funds that nobody cares about.
The report is split into two parts: The winners that are above their trend line (%M/A), and the losers that are below it. The yellow line is the line of shame that separates them. You can see how many ETFs are in each group and how they have changed since the last report (163 vs. 180 current).
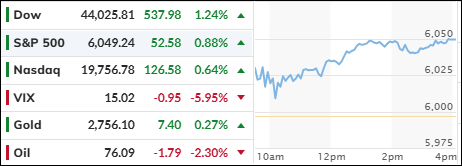
S&P 500 RETREATS AFTER RECORD HIGH, BUT WEEKLY GAINS PERSIST
[Chart courtesy of MarketWatch.com]
Moving the market
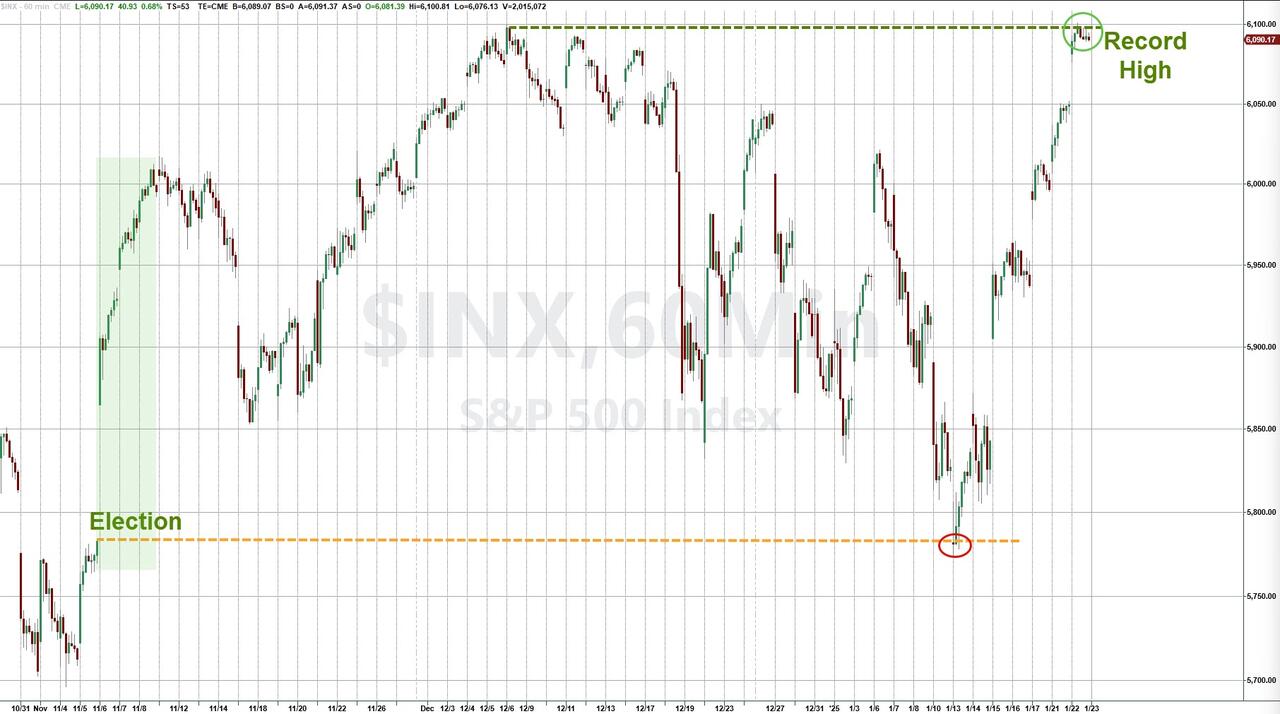
After reaching a new record high early in the day, the S&P 500 retreated but remained close to its unchanged line, positioning itself for a second consecutive weekly gain.
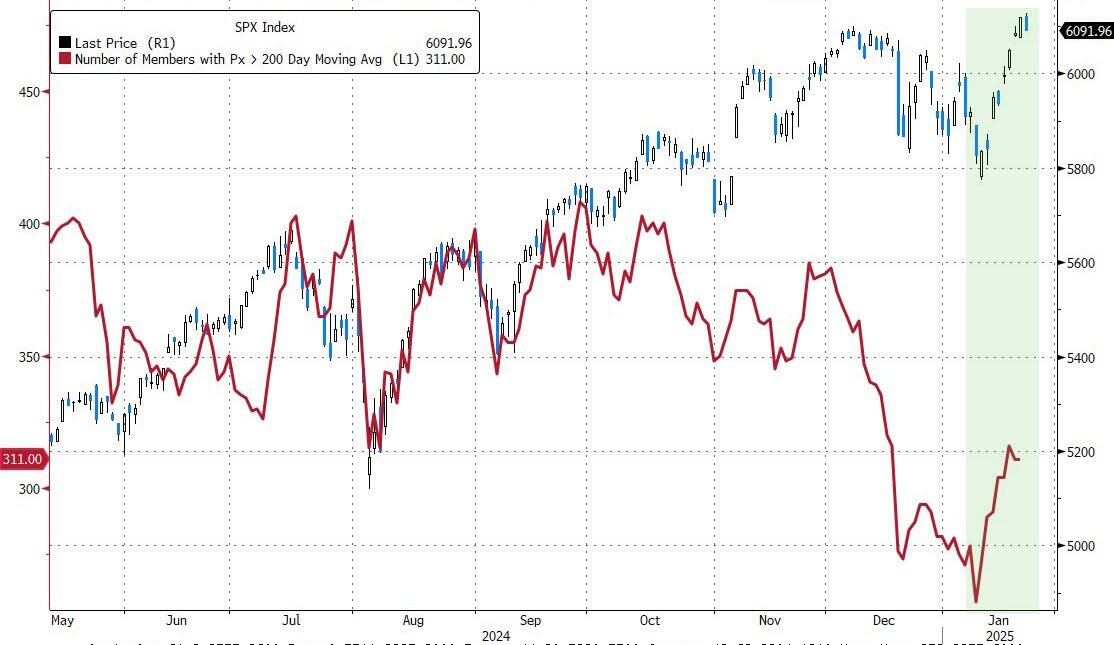
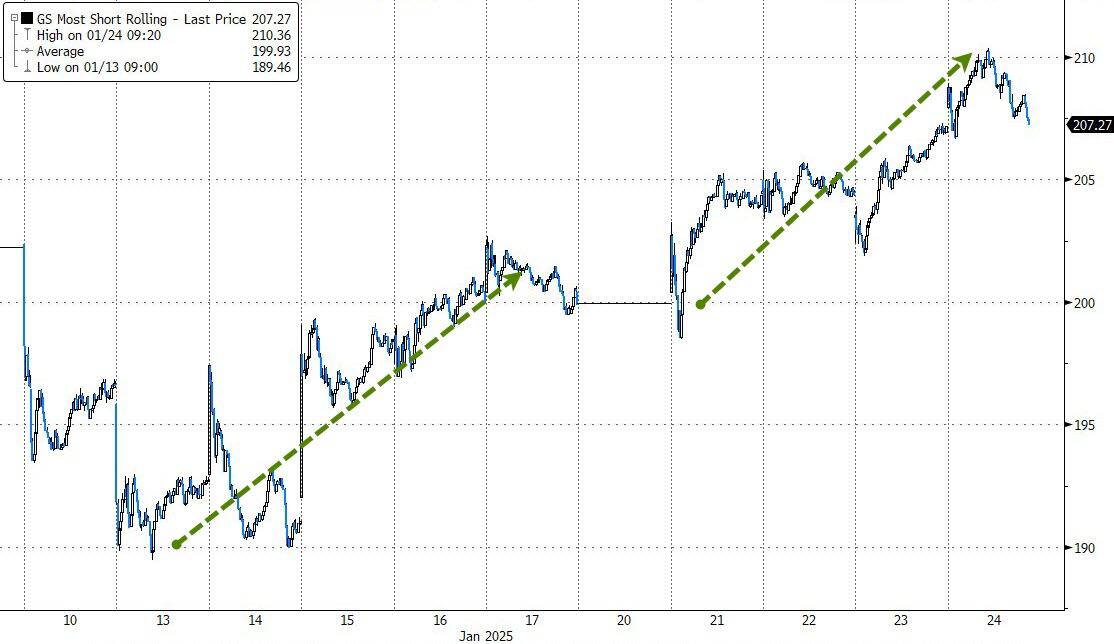
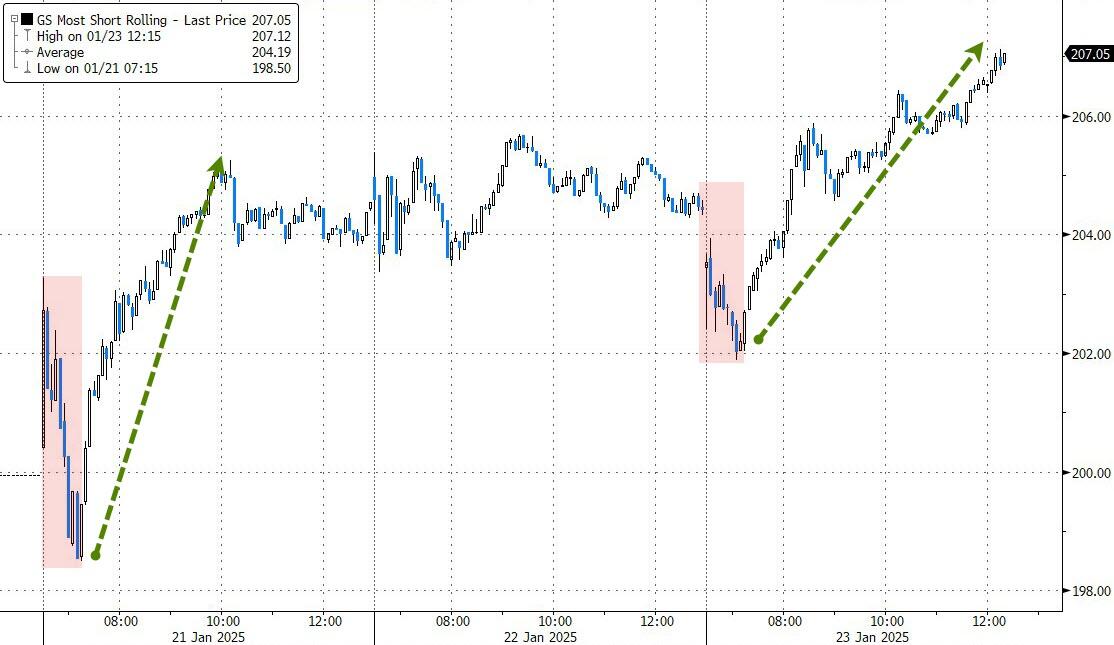
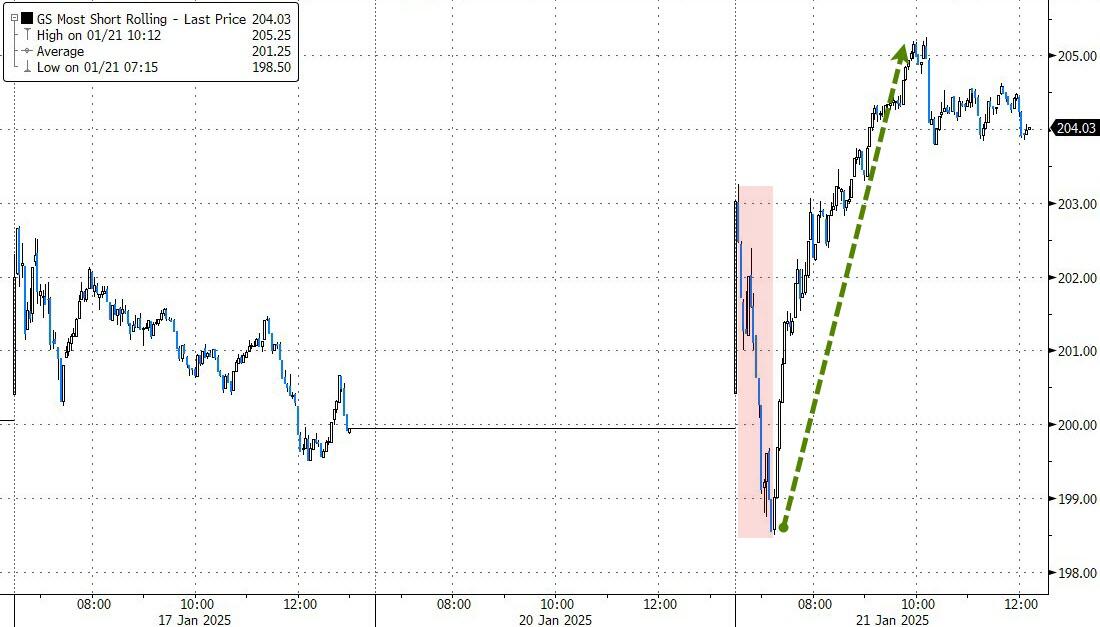
However, sentiment turned bearish by the end of the day, leading the major indexes to close in the red. Despite this, the week ended on a positive note, with market breadth improving significantly and the short squeeze continuing.
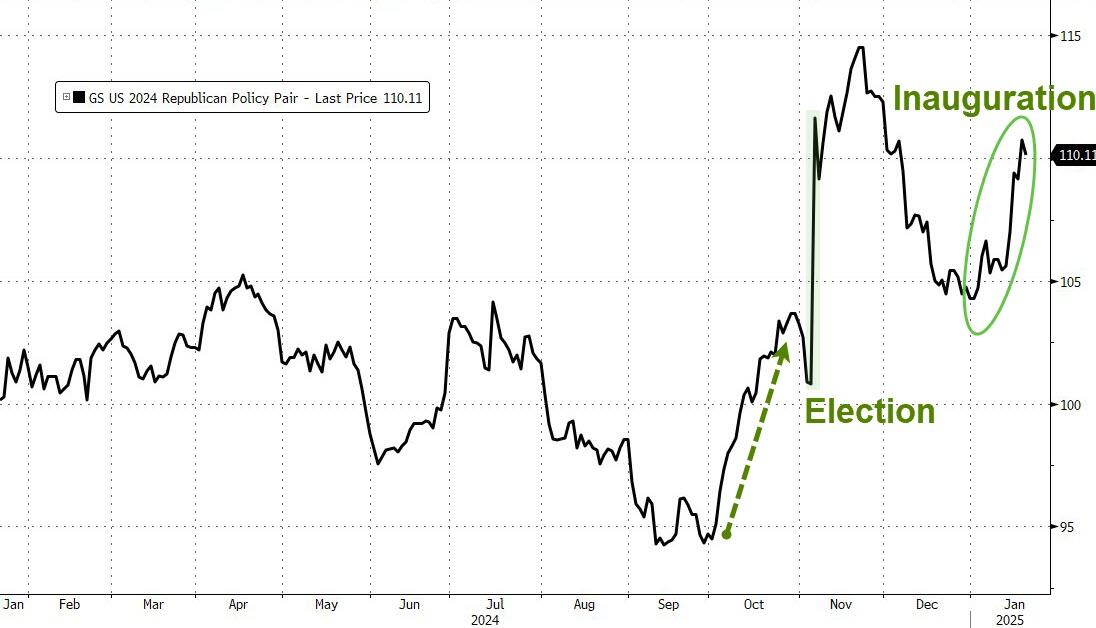
Equities benefited from pro-business policies, with traders relieved that the threat of tariffs has so far been limited to announcements rather than formal actions.
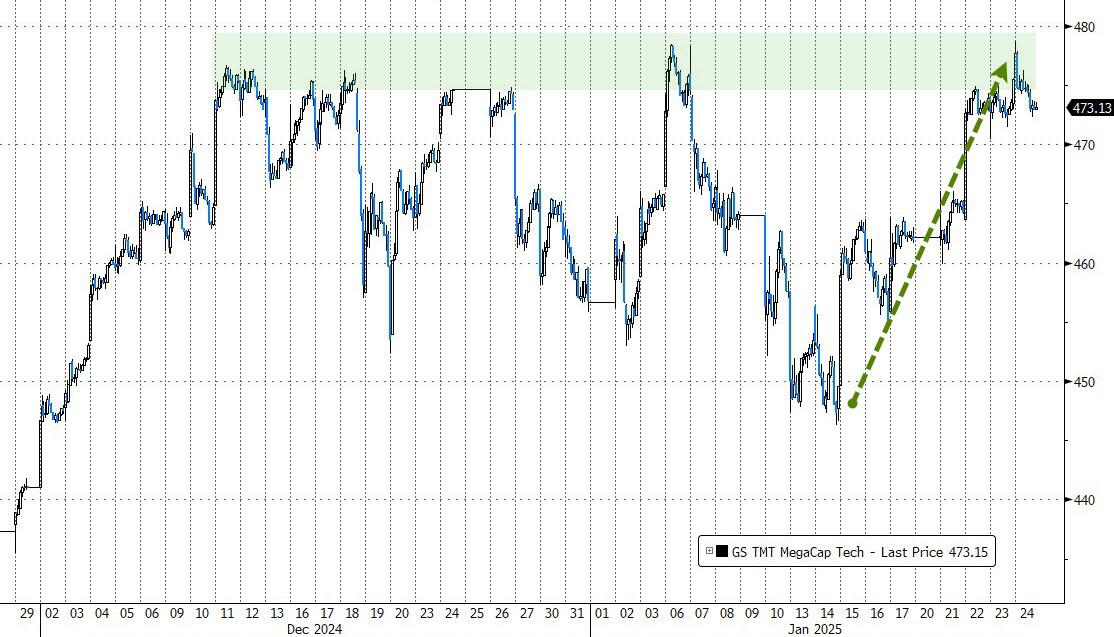
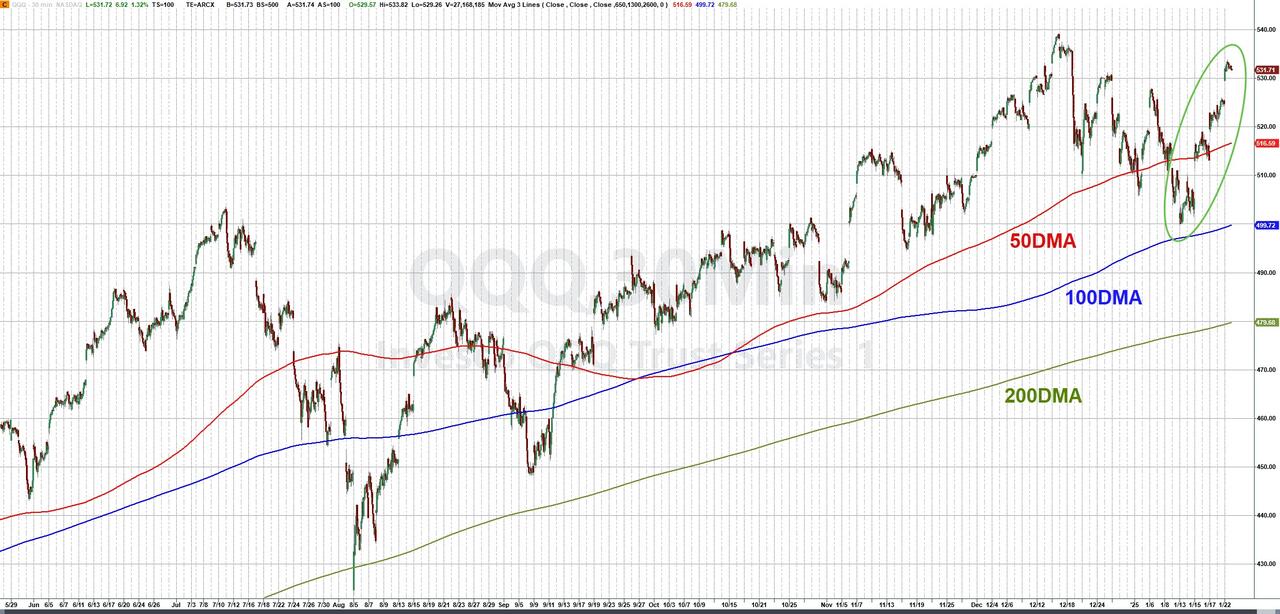
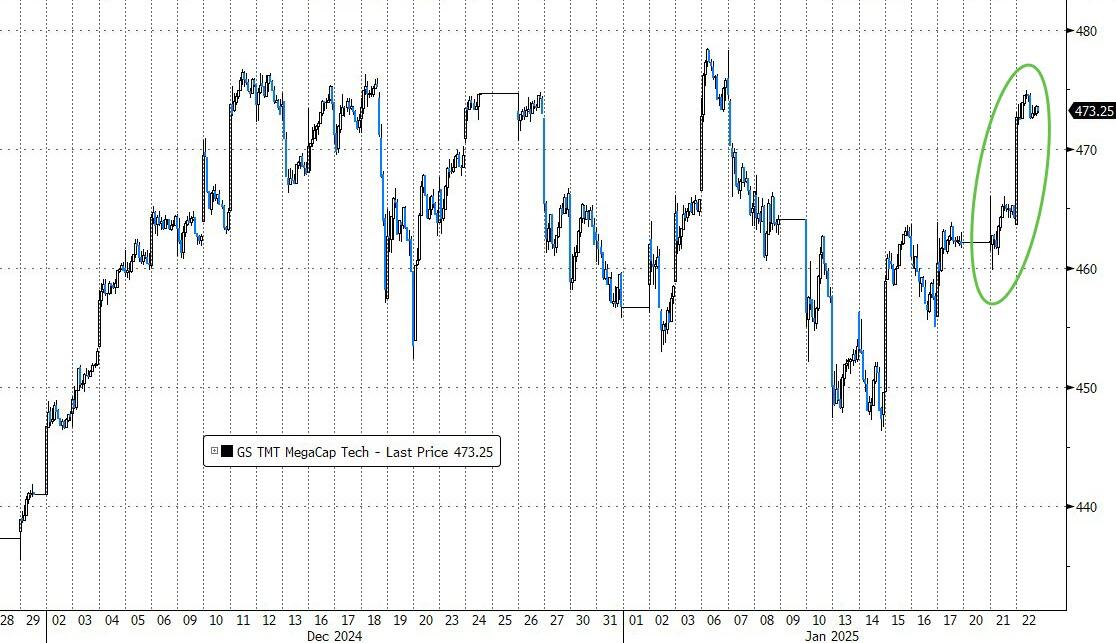
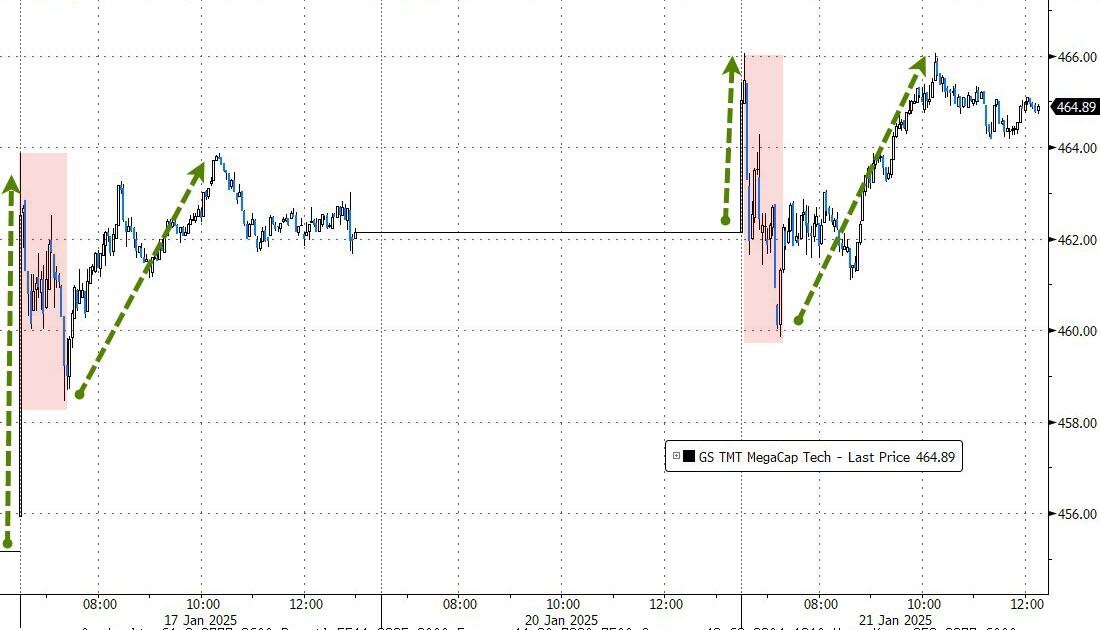
The mega-cap tech sector rallied for the second straight week, closing near its highs. The past couple of weeks have been positive, suggesting that the December pullback may be over and bullish sentiment has returned. This optimism is further supported by Trump’s demands for lower interest rates and a reduction in oil prices.
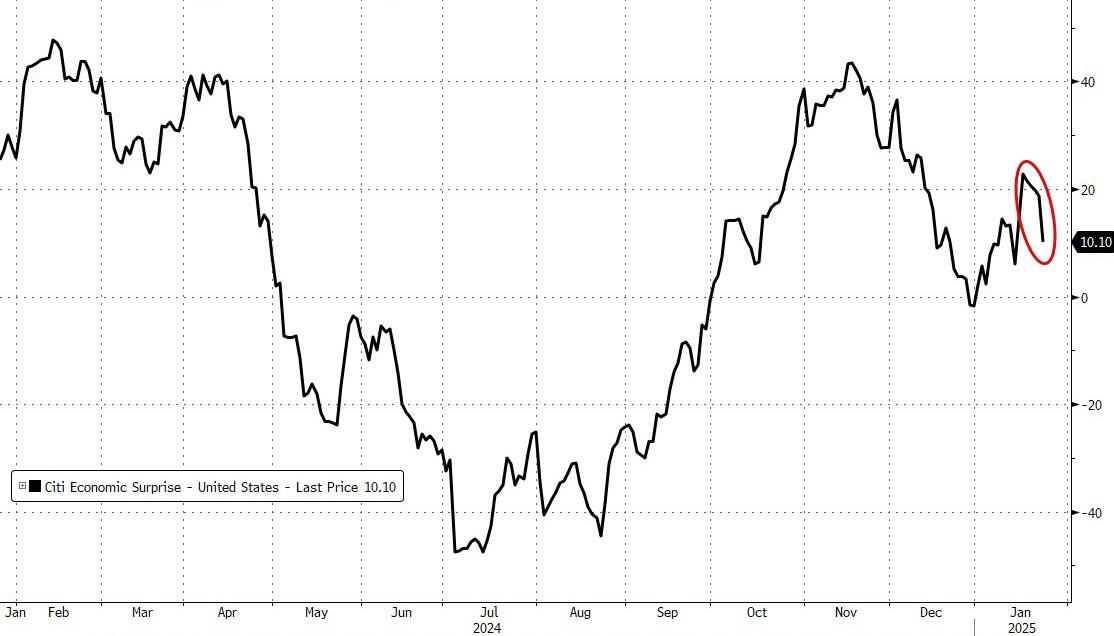
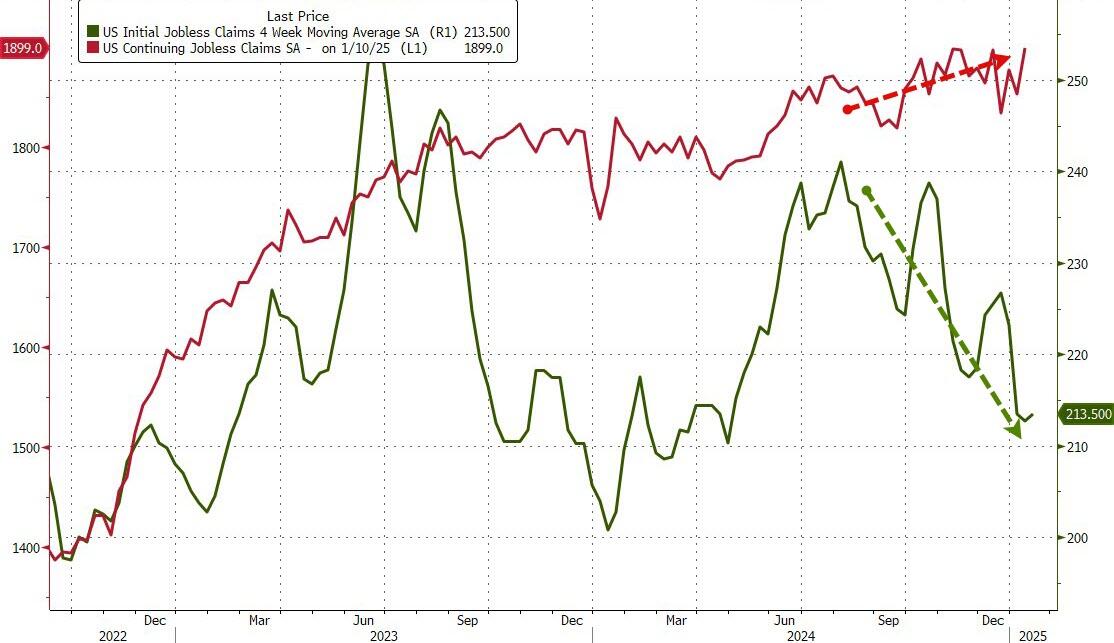
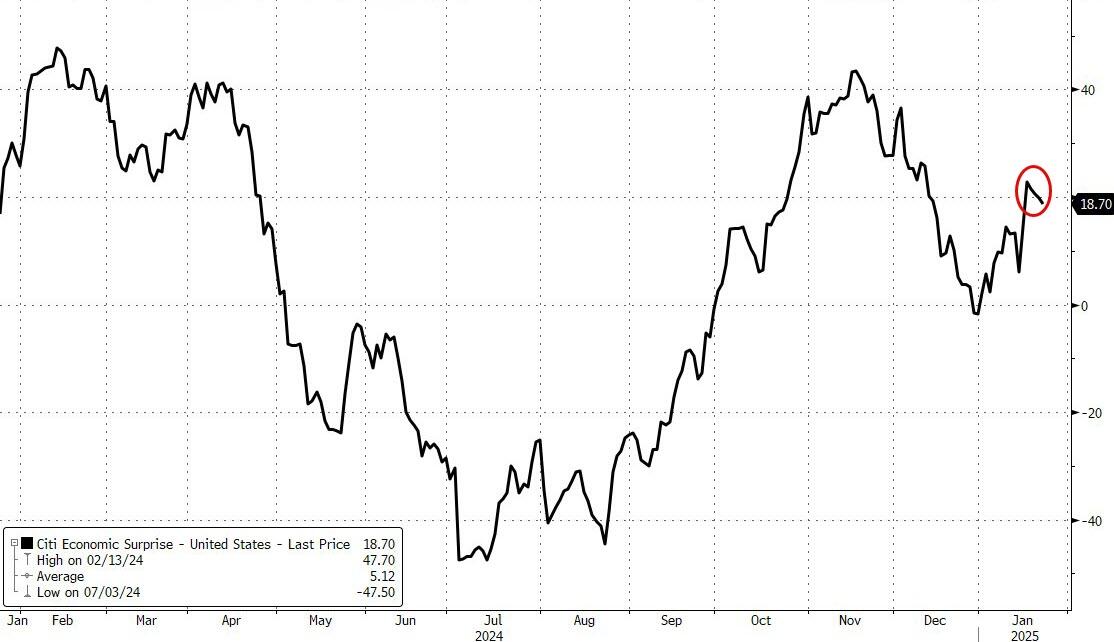
While macroeconomic data initially showed improvement, the week ended on a down note with a decline in services and rising inflation expectations.
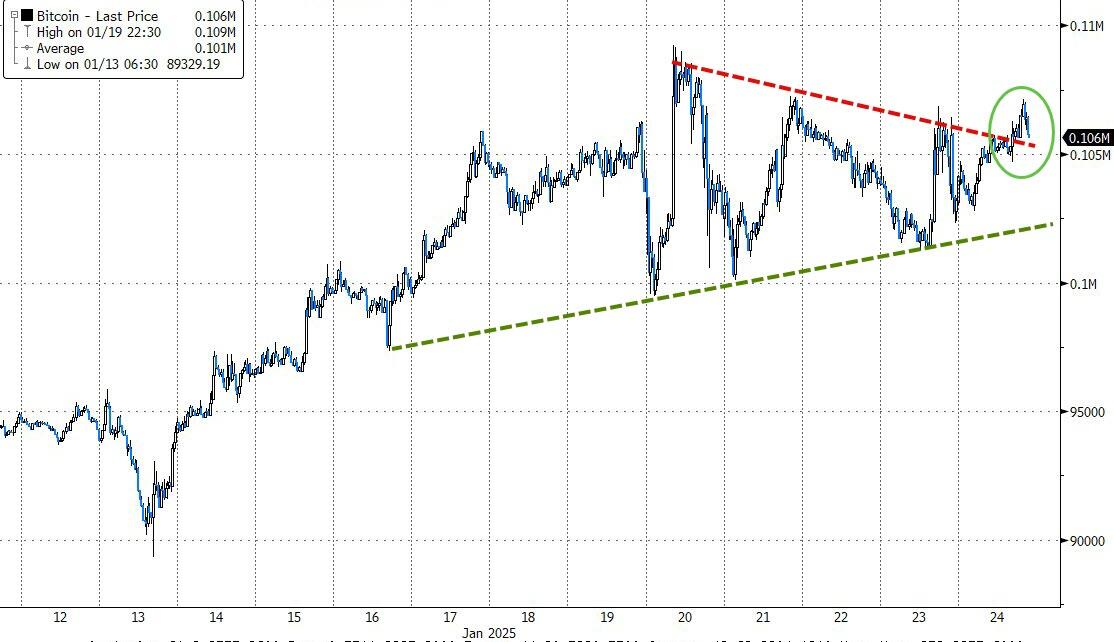
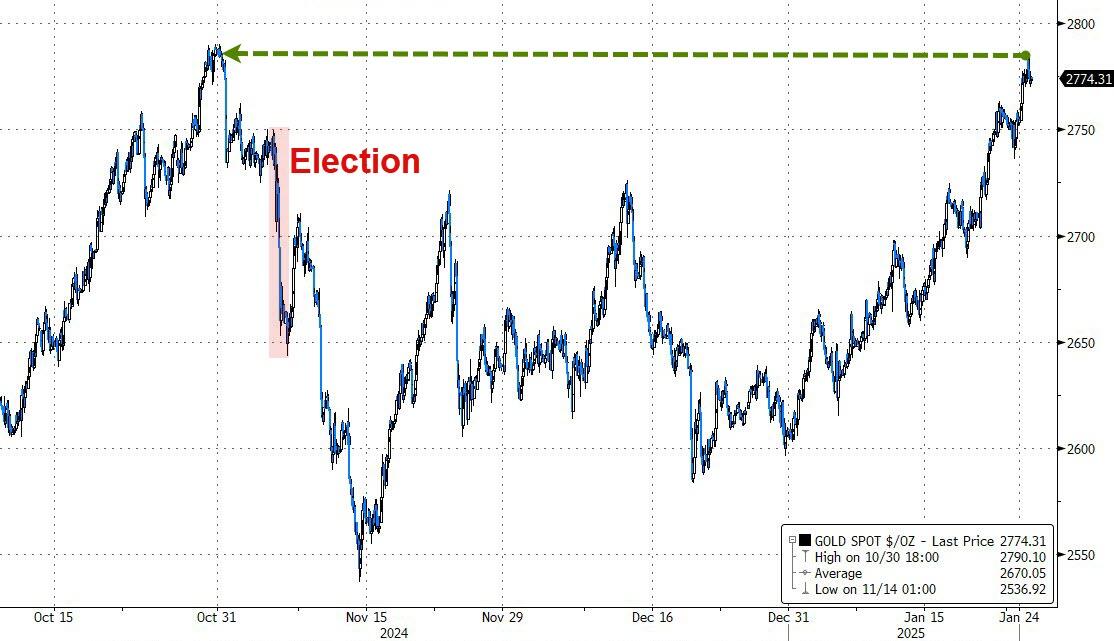
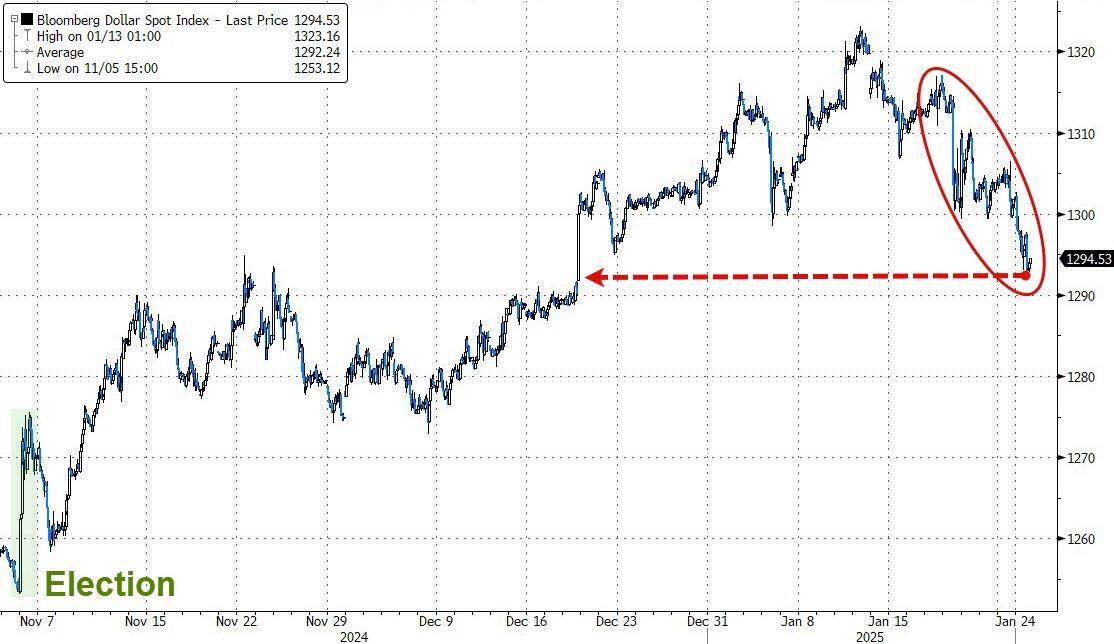
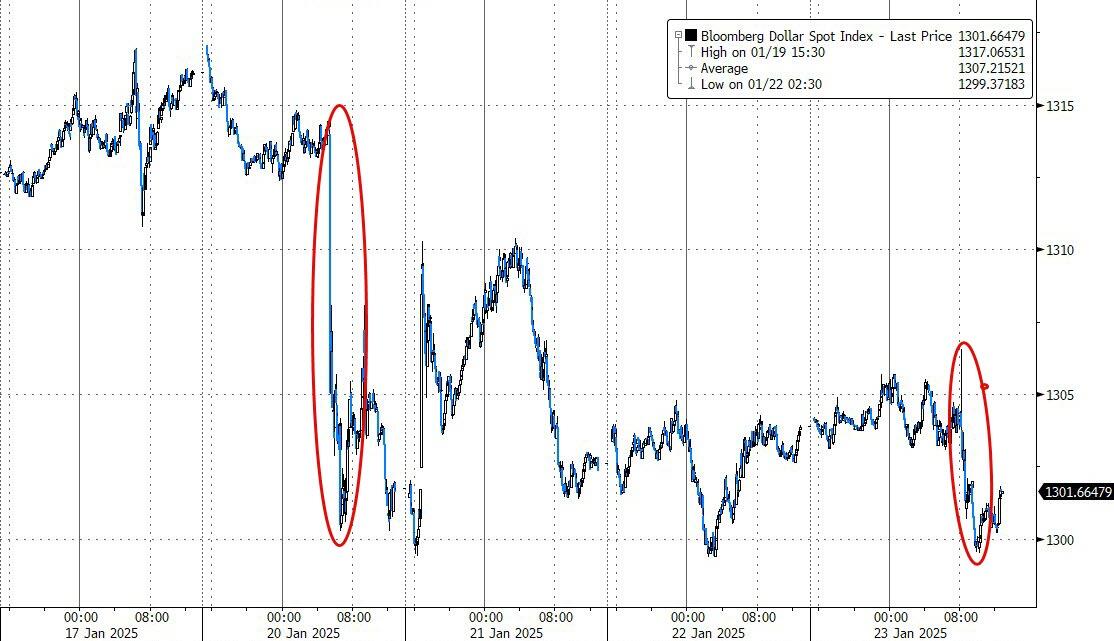
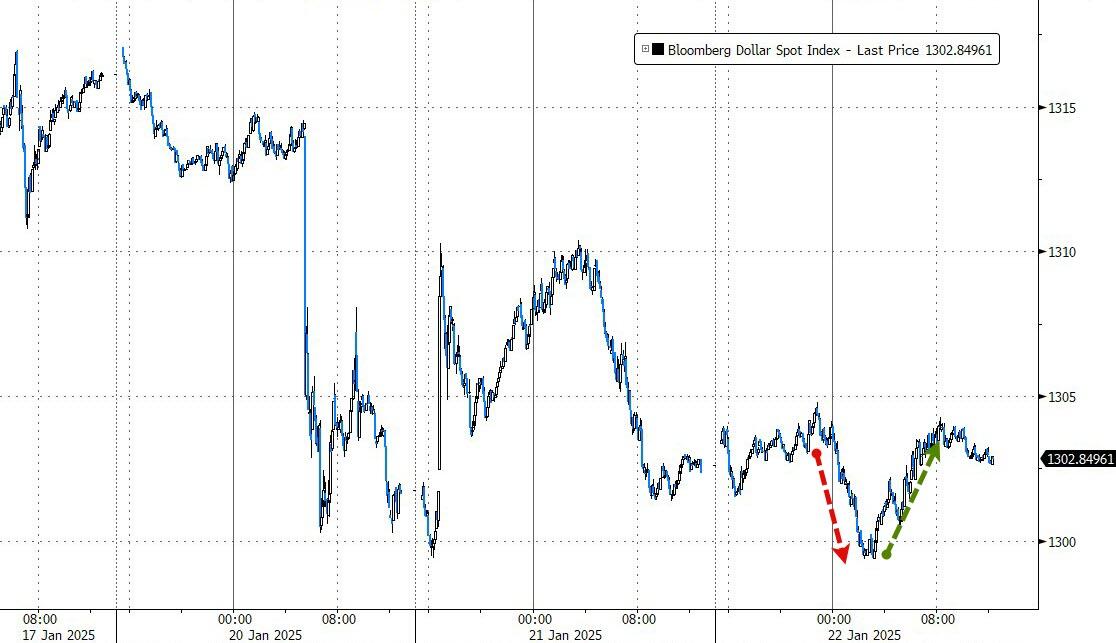
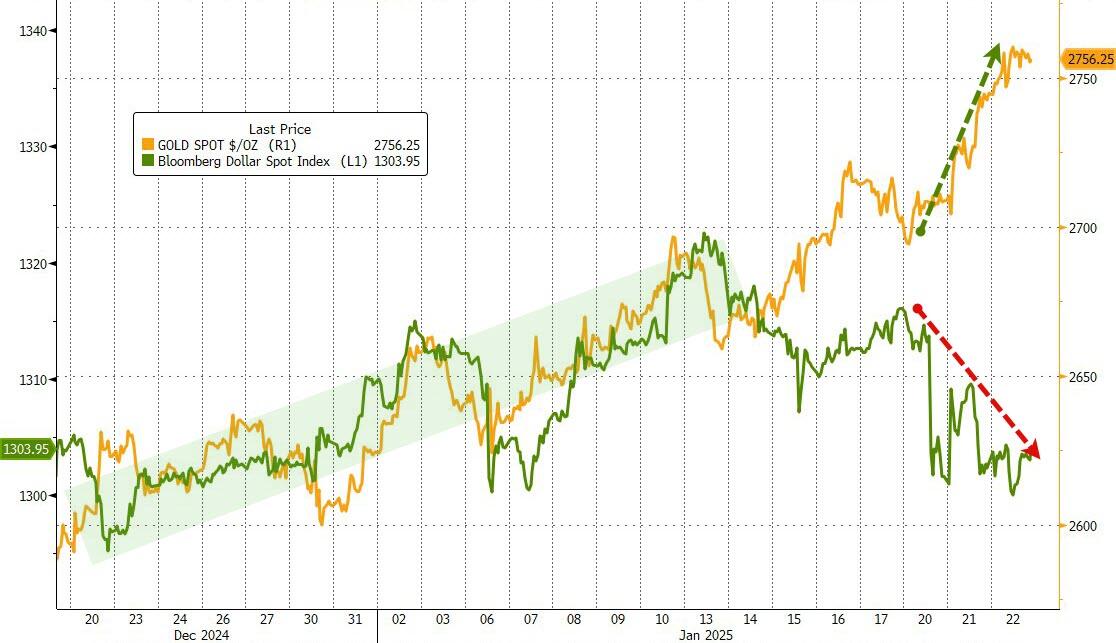
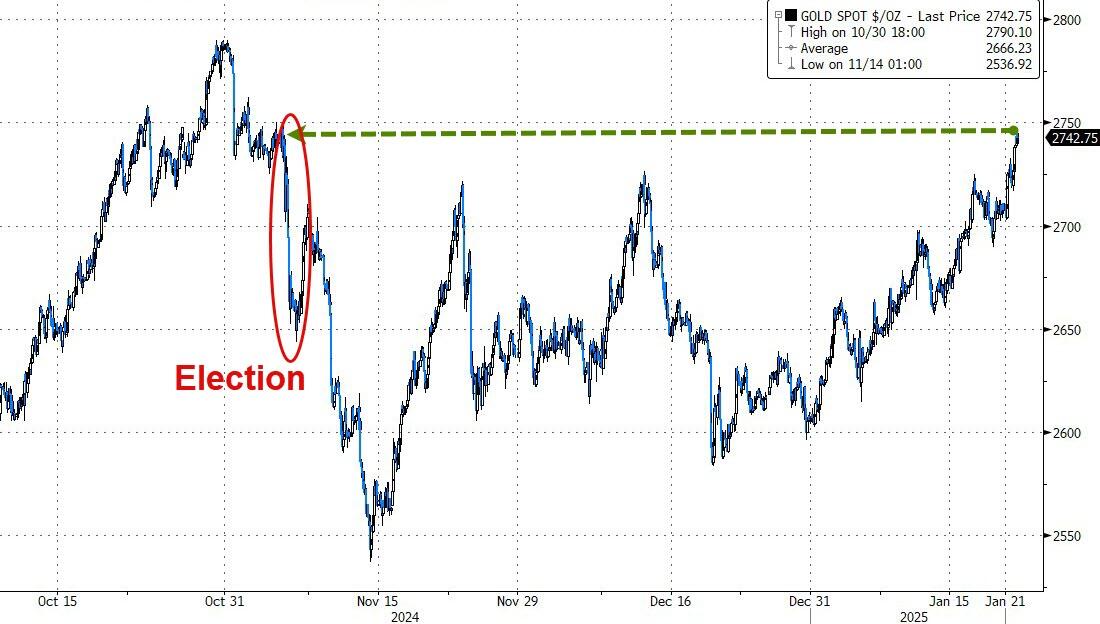
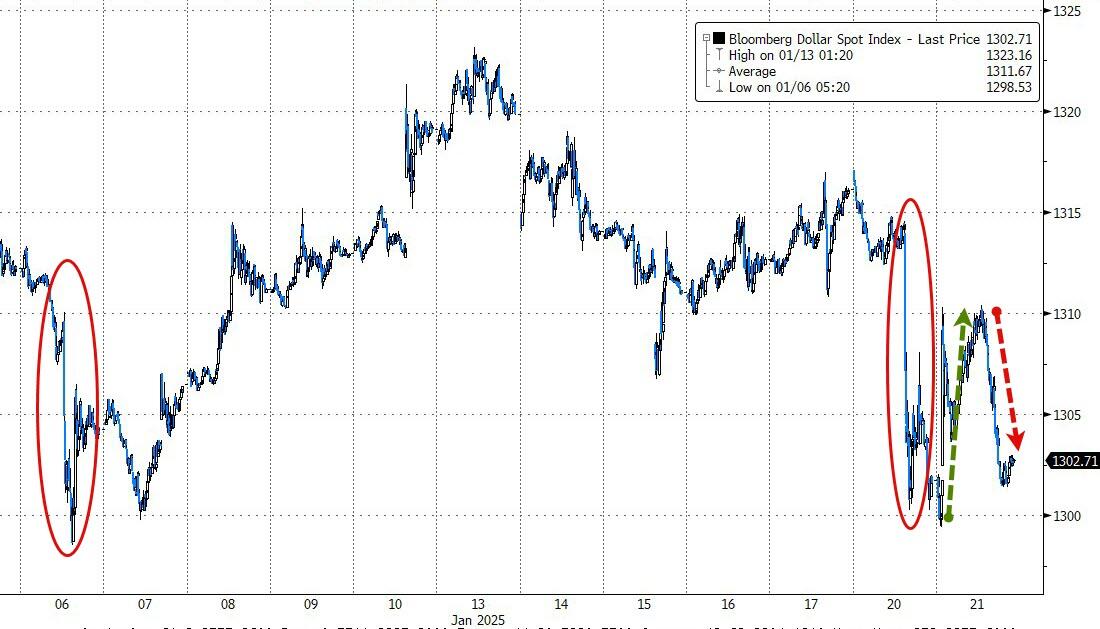
Bitcoin and gold extended their gains, with gold nearing its all-time high. Conversely, the dollar suffered its biggest drop since July 2023.
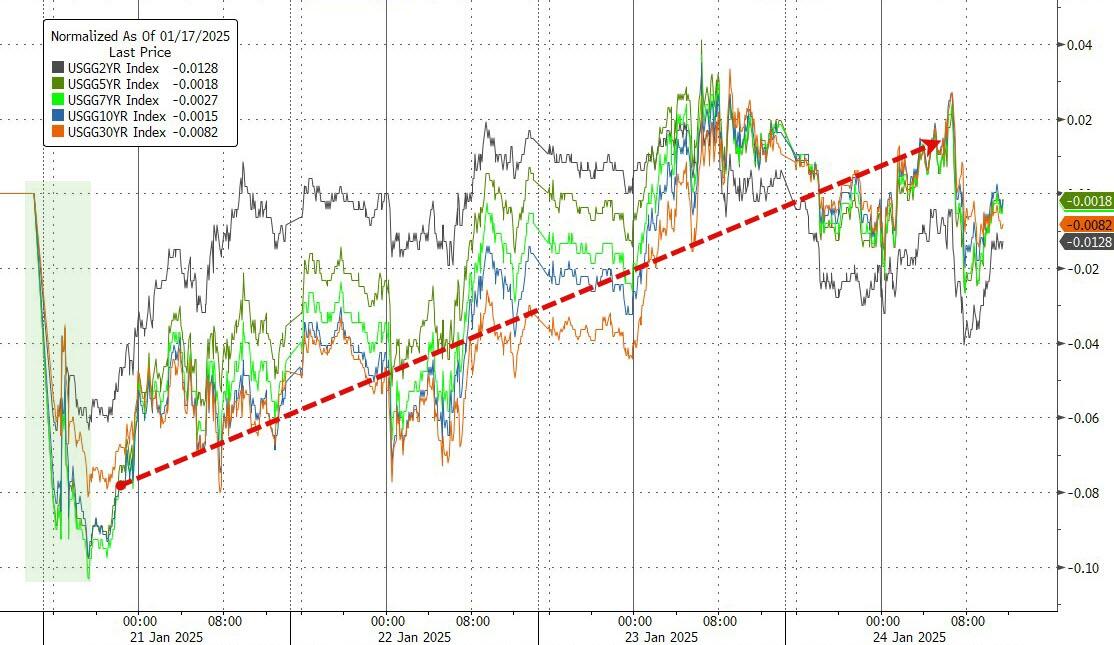
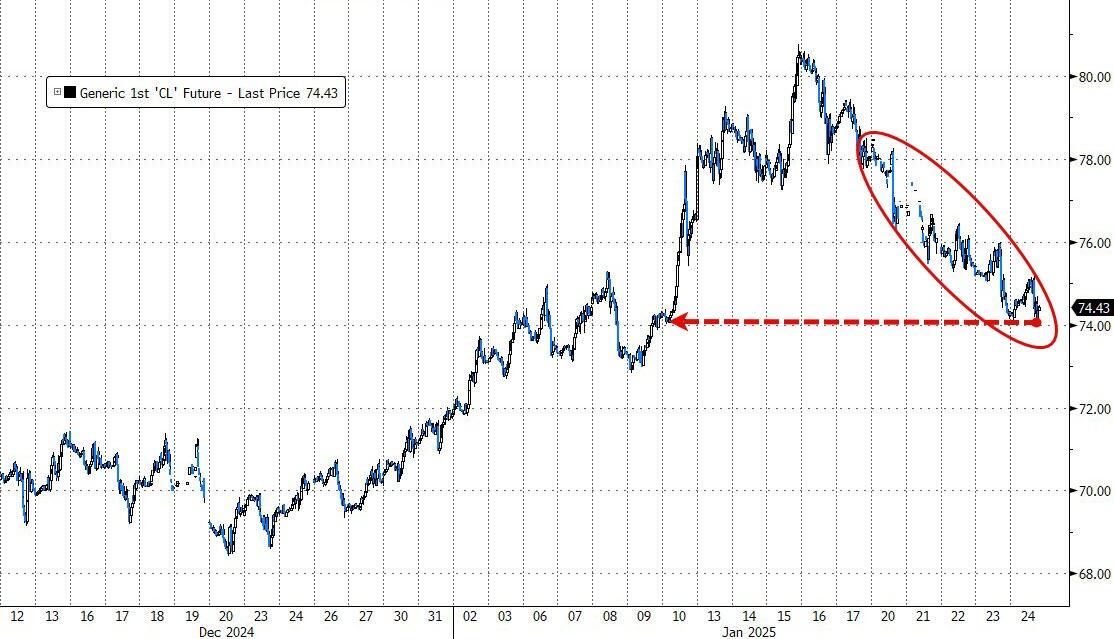
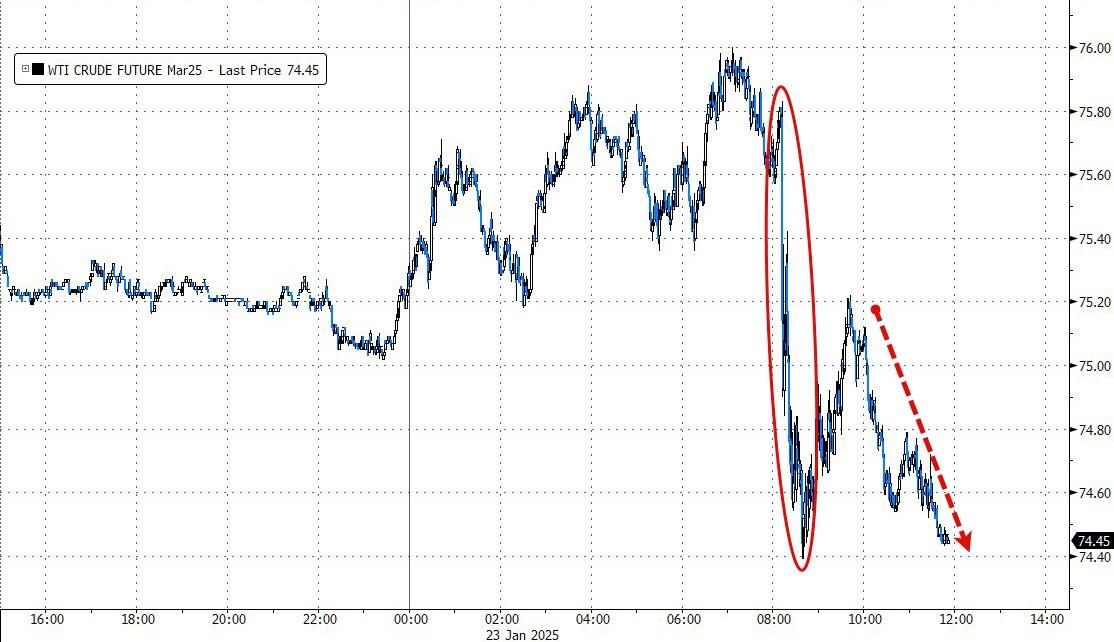
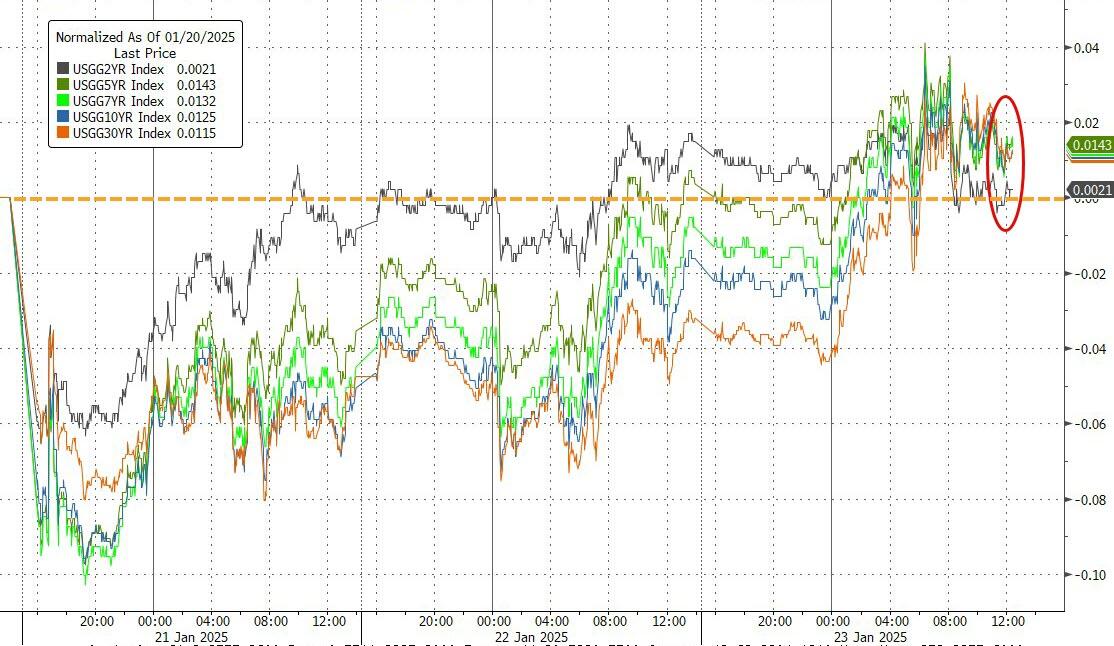
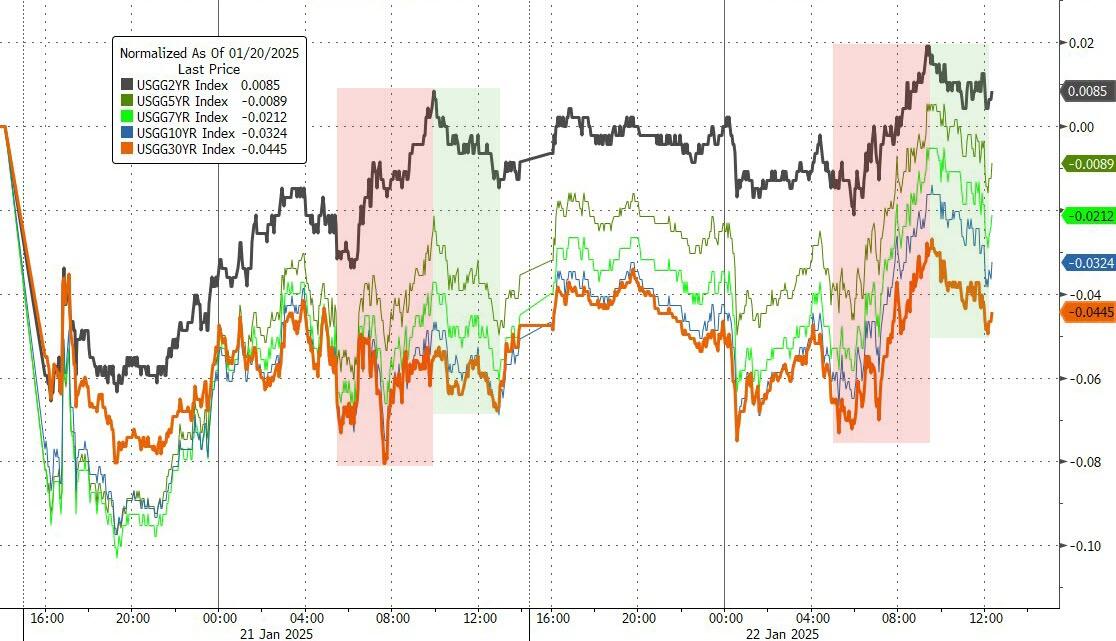
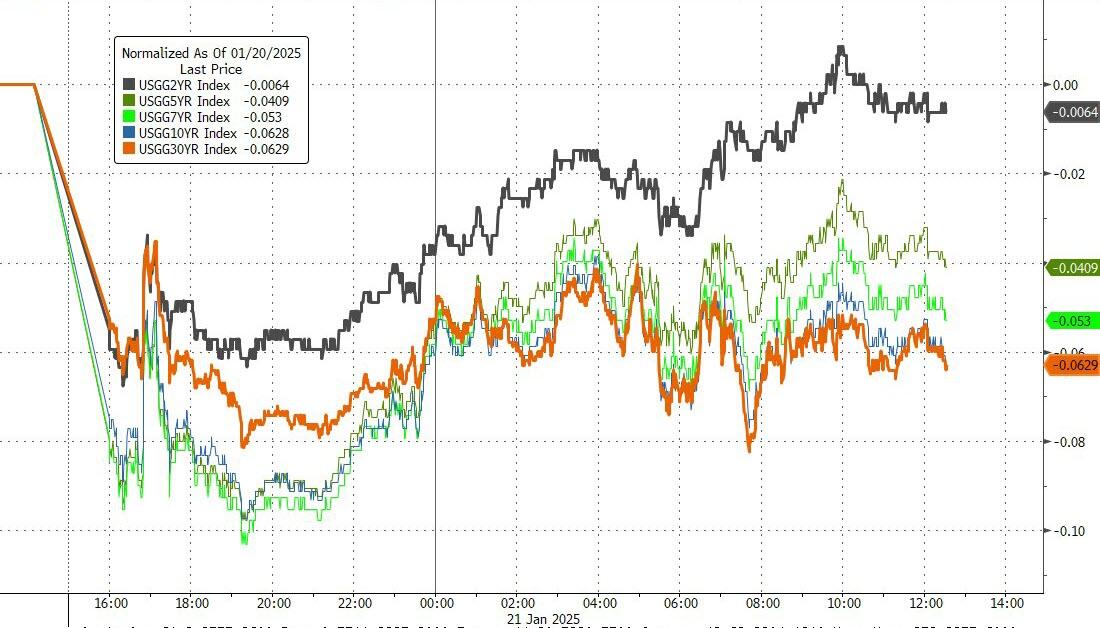
Bond yields, after a sharp drop last Tuesday, rallied back to close the week about unchanged. Crude oil prices experienced their largest weekly drop in three months and have been down for six consecutive days.
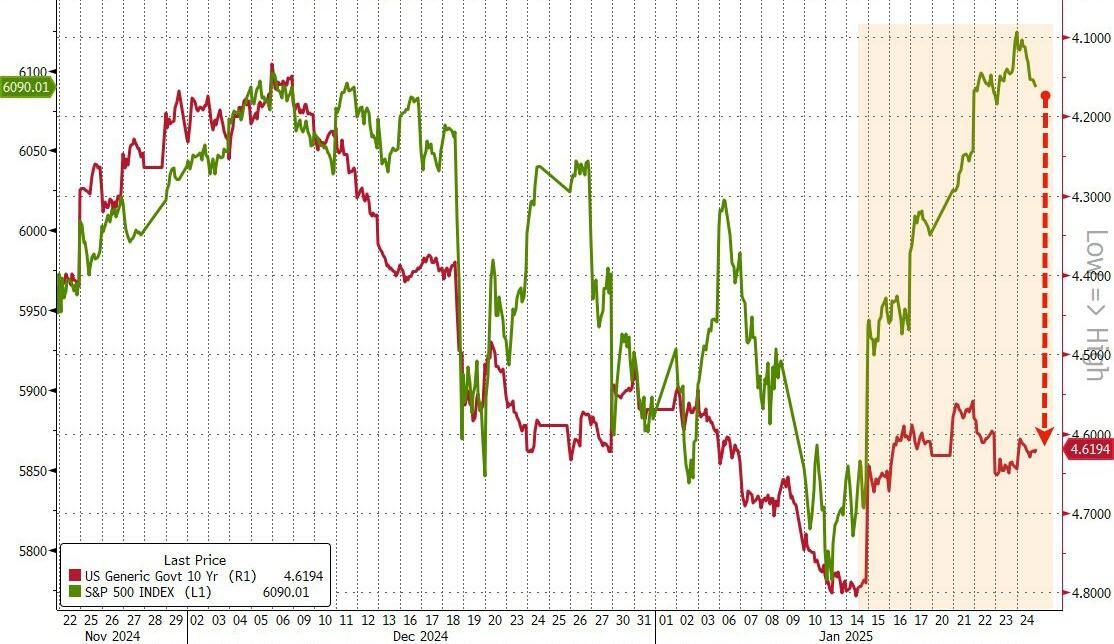
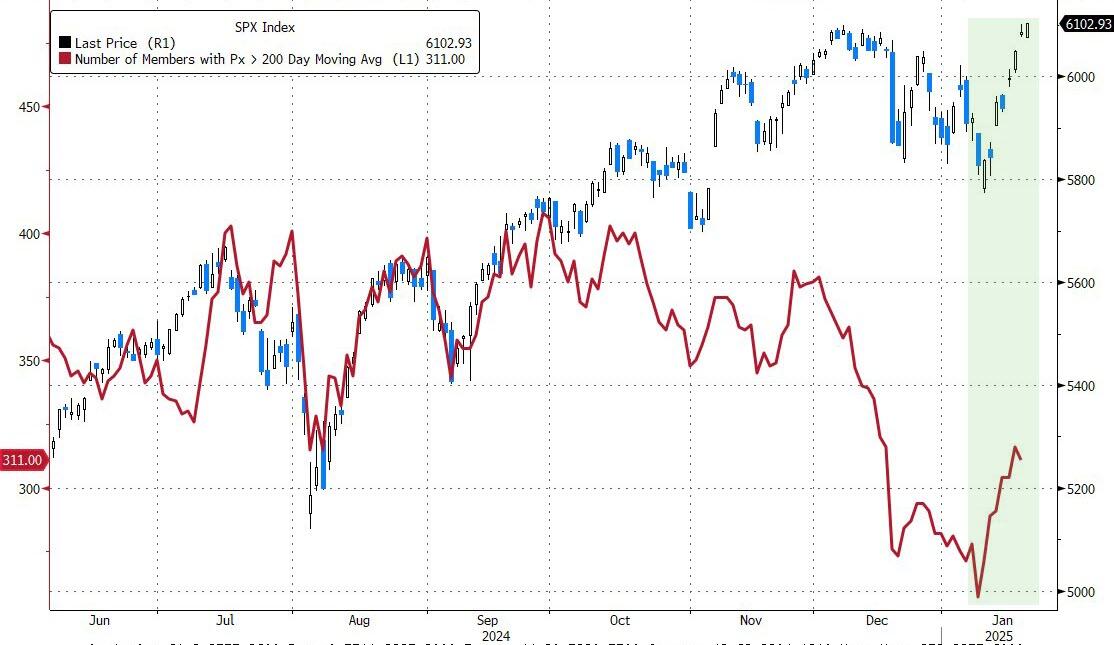
I find it interesting to observe divergences in asset classes that typically move in sync. Currently, stocks and bonds are presenting such a divergence, particularly when comparing the S&P 500 to the 10-year bond yield.
This chart highlights the current conundrum, suggesting that a correction in equities may be on the horizon.
ETF Data updated through Thursday, January 23, 2025
How to use this StatSheet:
Out of the 1,800+ ETFs out there, I only pick the ones that trade over $5 million per day (HV ETFs), so you don’t get stuck with a lemon that nobody wants to buy or sell.
Trend Tracking Indexes (TTIs)
These are the main indicators that tell you when to buy or sell Domestic and International ETFs (section 1 and 2). They do that by comparing their position to their long-term M/A (Moving Average). If they cross above, and stay there, it’s a green light to buy. If they fall below, and keep going, it’s a red light to sell. And to make sure you don’t lose your shirt if things go south, I also use a 12% trailing stop loss on all positions in these categories.
All other investment areas don’t have a TTI and should be traded based on the position of each ETF relative to its own trend line (%M/A). That’s why I call them “Selective Buy.” In other words, if an ETF goes above its own trend line, you can buy it. But don’t forget to use a trailing sell stop of 12%, or less if you’re feeling nervous.
If some of these words sound like Greek to you, please check out the Glossary of Terms and new subscriber information in section 9.
DOMESTIC EQUITY ETFs: BUY— since 11/21/2023
Click on chart to enlarge
This is our main compass, the Domestic Trend Tracking Index (TTI-green line in the above chart). It has broken above its long-term trend line (red) by +5.86% and is in “Buy” mode as posted.
Yesterday, the S&P 500 set an intra-day record, but it slipped early today as the overall markets showed weakness, likely due to profit-taking. However, the index regained momentum later in the session, closing in the green once again.
Recent market advances have been fueled by optimism surrounding potential tax cuts and deregulation under the Trump administration, along with signs of more resilient economic growth. The idea of tariffs has received mixed responses, and only time will tell if they will be as beneficial as initially anticipated.
The fourth-quarter earnings season is off to a strong start, with Netflix and major banks reporting better-than-expected results. However, American Airlines was a notable exception, offering weak guidance and seeing its stock plummet by 6%.
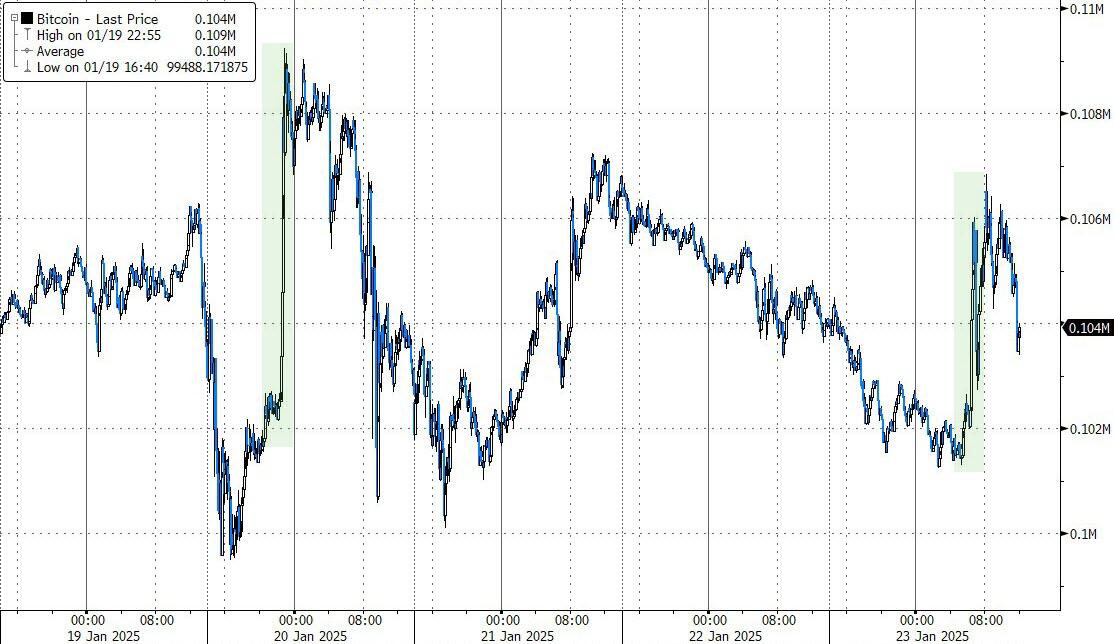
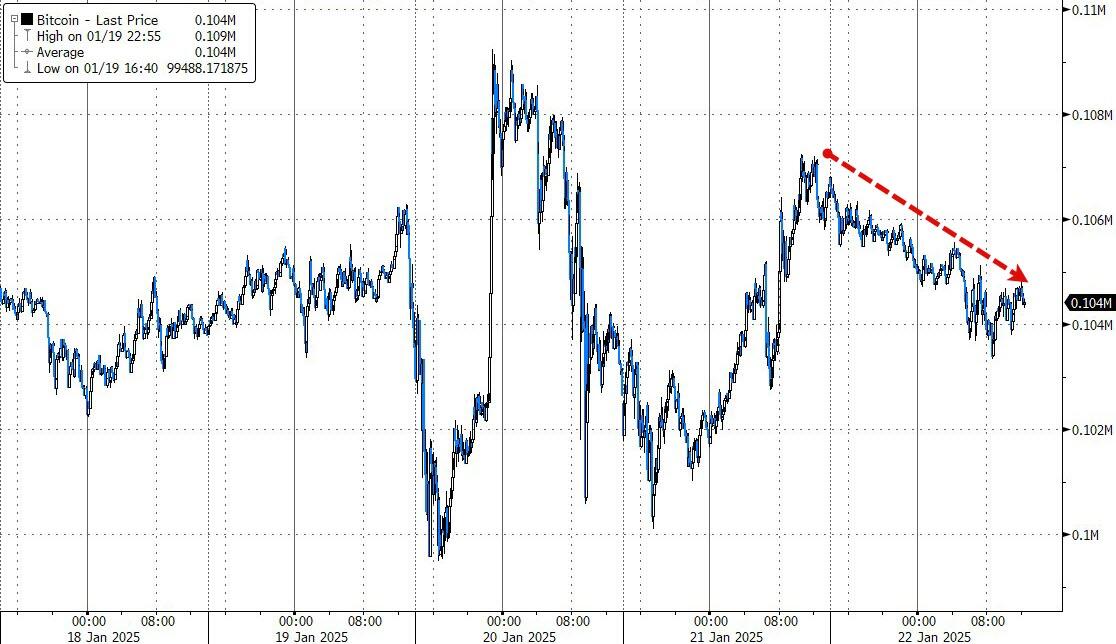
Crude oil prices fell again, influenced by Trump’s “drill, baby, drill” stance. Bitcoin surged past $106,000 but gave back some of those gains by the close.
The Nasdaq lagged today, but small-cap stocks were buoyed by another short squeeze, as the markets overall benefited from improved market breadth over the past week.
Bond yields edged higher, and the dollar weakened on tariff threats, as Trump continued his criticism of high oil prices and interest rates.
Bullish sentiment persisted today, with the S&P 500 reaching a new all-time high, driven by strong performance in the tech sector. The Nasdaq led the way, while Small Caps lagged and ended the session in the red.
Oracle (+6%) and Nvidia (+4%) saw significant gains, fueled by optimism surrounding AI and the announcement of a $500 billion AI infrastructure investment by Stargate, which boosted the entire mega-tech sector. Even the announcement of a 10% tariff on China starting February 1 by President Trump couldn’t dampen the market’s enthusiasm.
Netflix (+10%) and Procter & Gamble also advanced, thanks to strong quarterly earnings reports. Traders appear to be in sync with the recent market-friendly executive orders from the new administration, particularly those focused on deregulation and energy.
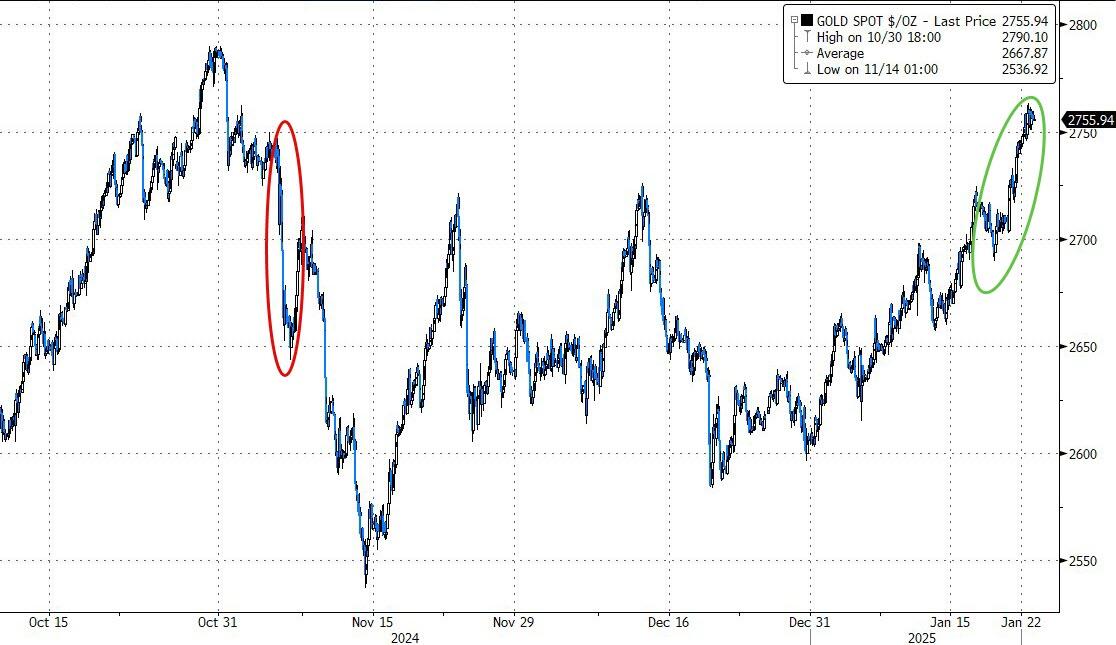
Today’s market rally occurred despite rising bond yields, which helped the dollar recover from yesterday’s sell-off. Gold remained unaffected by these movements, climbing towards its all-time highs, and decoupling from its usual correlation with the dollar.
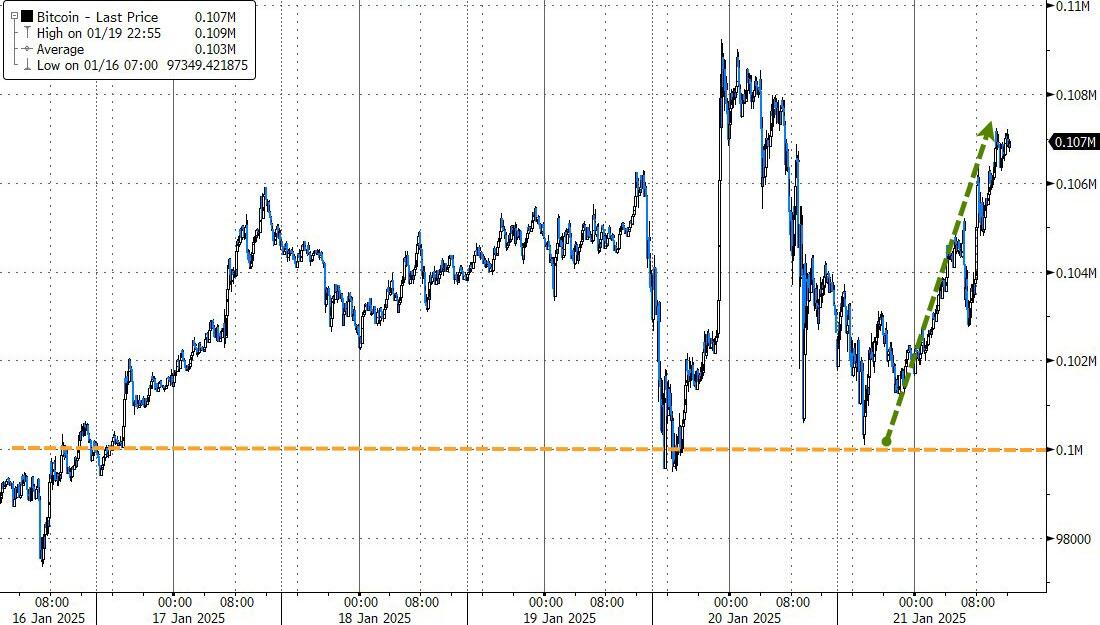
Bitcoin, meanwhile, seemed to be consolidating after yesterday’s bounce, drifting moderately lower. This could potentially set the stage for its next leap into record territory.
The major indexes began the “post-inauguration” session with a positive outlook, as traders interpreted Trump’s comments on tariffs as less severe than initially anticipated.
Small Caps led the early surge, bolstered by a better-than-expected earnings report from 3M, which saw its stock rise by more than 4%.
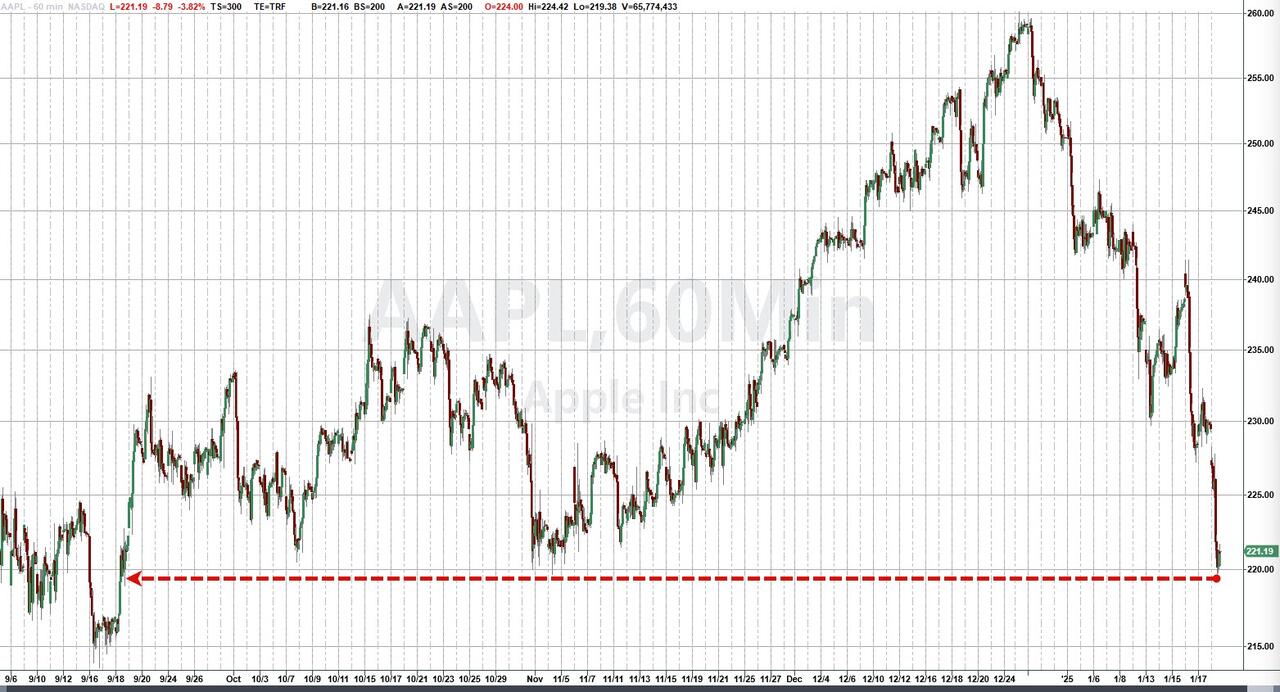
Mega-tech companies like Amazon and Alphabet also contributed to the upswing. However, Apple, having faced two downgrades and now down 16% from its record highs, kept the Nasdaq from fully participating in the rally.
On Trump’s first day back in the Oval Office, unfair trade practices were a key focus. He issued a broad memorandum to Federal agencies to study the issue in more detail, easing Wall Street’s fears of an overly aggressive approach.
Gold rallied, reclaiming the $2,750 level, and erasing all post-election losses. Bitcoin, after bouncing off the $100k level, surged back above $107k, just shy of its record high of $109k.
Falling bond yields and a short squeeze provided the necessary momentum for today’s market rise, while the dollar initially bounced but faded by the close.
I couldn’t help but chuckle as oil prices declined throughout the session, with Trump’s famous adage “drill, baby, drill” dampening any bullish sentiment.


