
ETF Tracker StatSheet
You can view the latest version here.
GOLD GLITTERS AND BITCOIN BOOMS AS THE DOLLAR DIVES
- Moving the markets
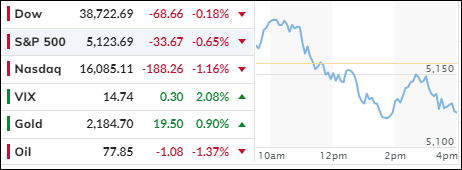
In the whimsical world of Wall Street, the major indexes took a rollercoaster ride, initially hitting the gas with bullish enthusiasm only to slam on the brakes and retreat, leaving Nvidia’s jaw-dropping rally needing a pit stop. The market wrapped up the week with a less-than-rosy hue, painting the town red.
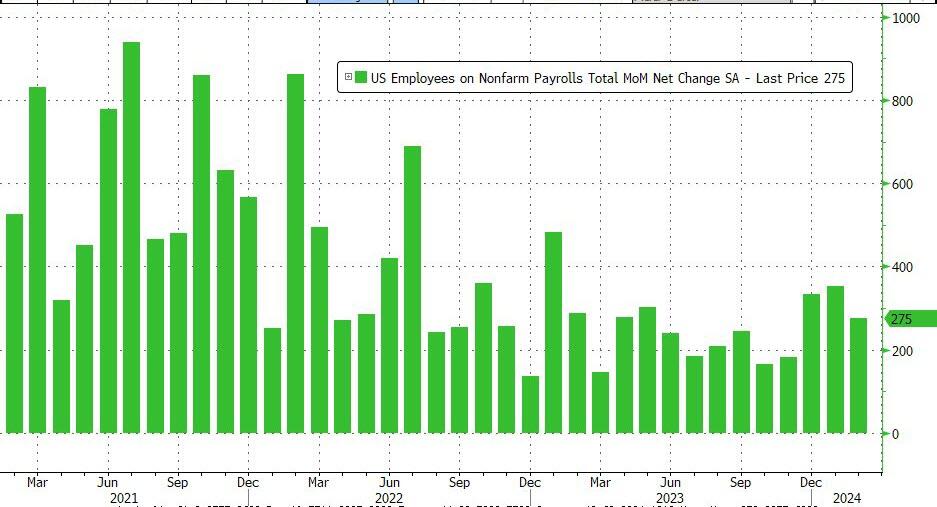
The February jobs report was like a cryptic crossword, giving mixed signals that left economists scratching their heads. The job count boomed to a surprising 275,000, overshooting the Dow Jones economists’ guess of 198,000. But before you pop the champagne, January’s blockbuster number got a reality check, slashed by 35% to a more modest 229k. And with the election year shenanigans, who’s to say February’s figures won’t get a makeover come April?
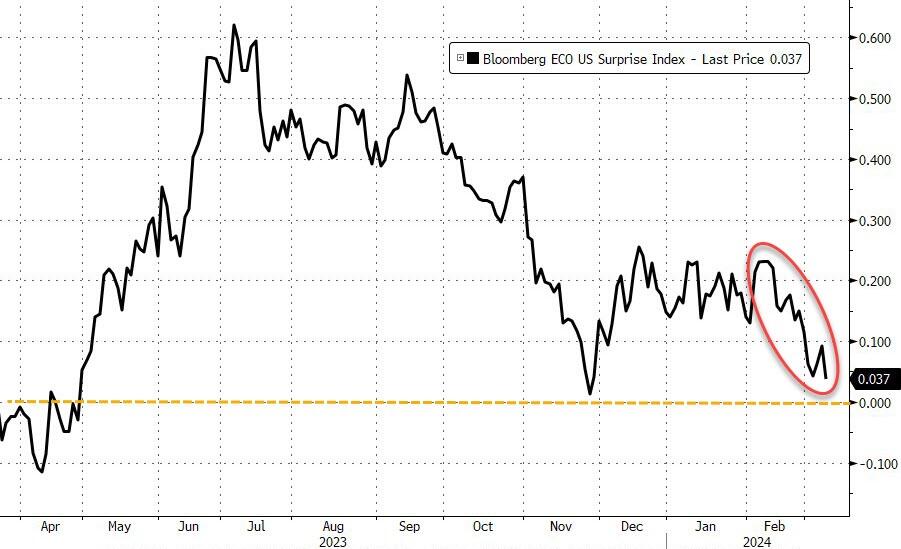
Meanwhile, the unemployment rate nudged up to 3.9%, and wage growth didn’t pack the punch feared, tossing a few crumbs of hope that inflation might just be tamed enough to charm the Fed. But don’t get too cozy; the macro data trend is looking more like a retreat than a victory march.
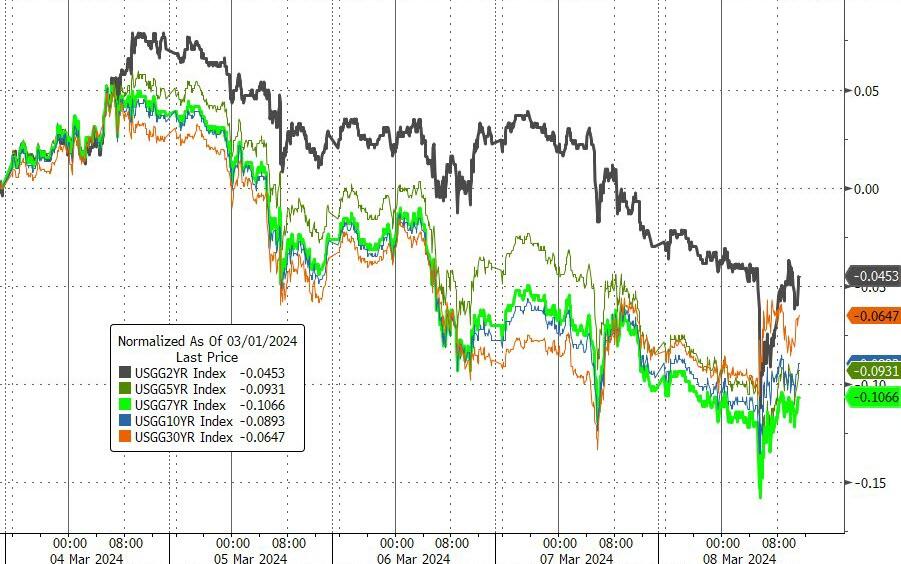
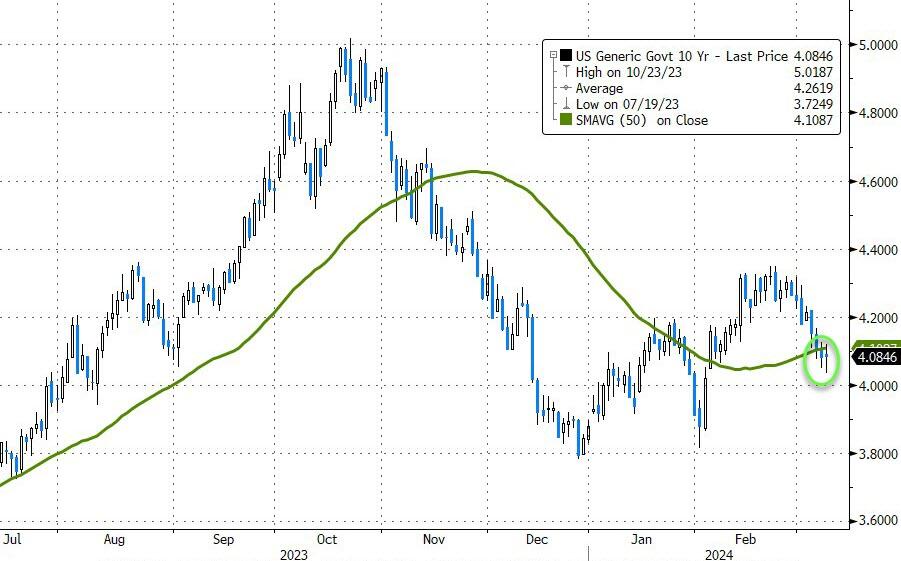
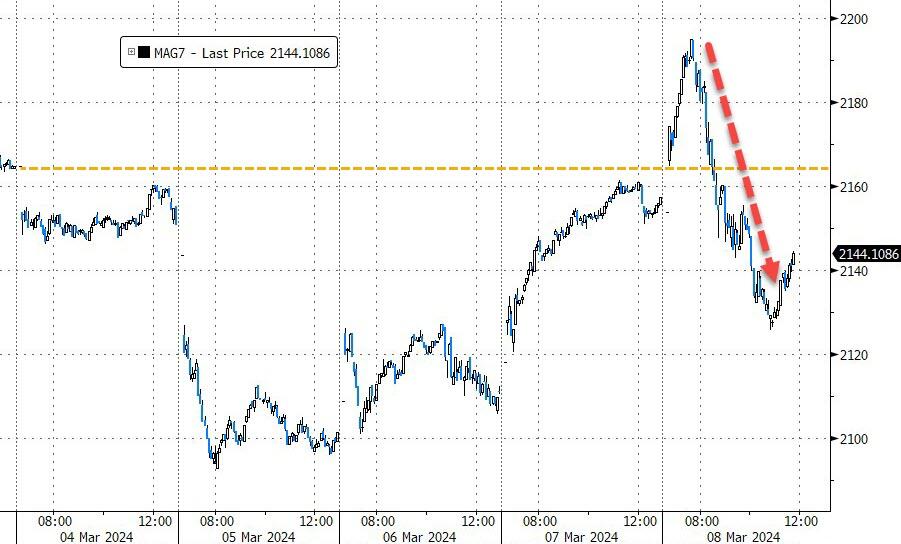
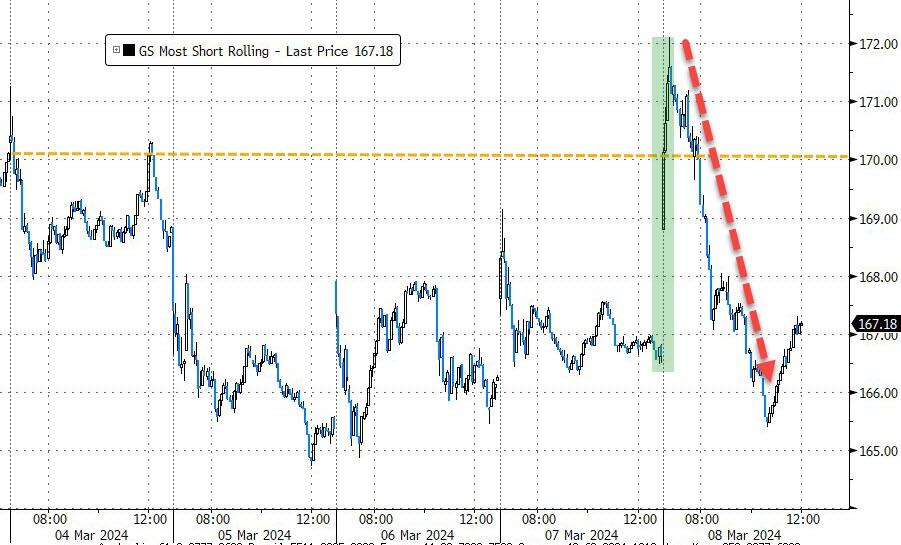
Bond yields took a leisurely slide all week, with the 10-year yield cozying up close to 4%. The tech titans, known as the Mag7, didn’t have their best week either, ending on a down note. And those stocks that were shorted like last season’s fashion? They plummeted back to their lows after a fleeting moment in the sun.
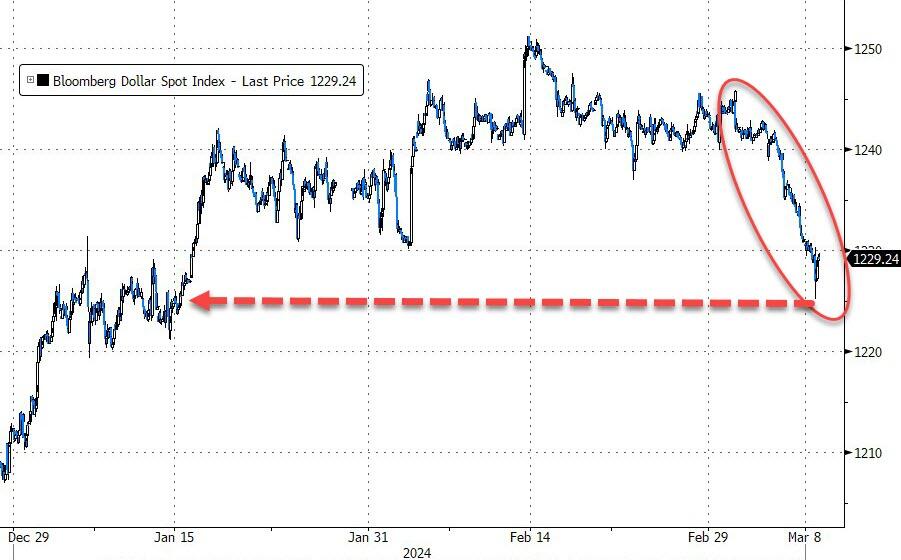
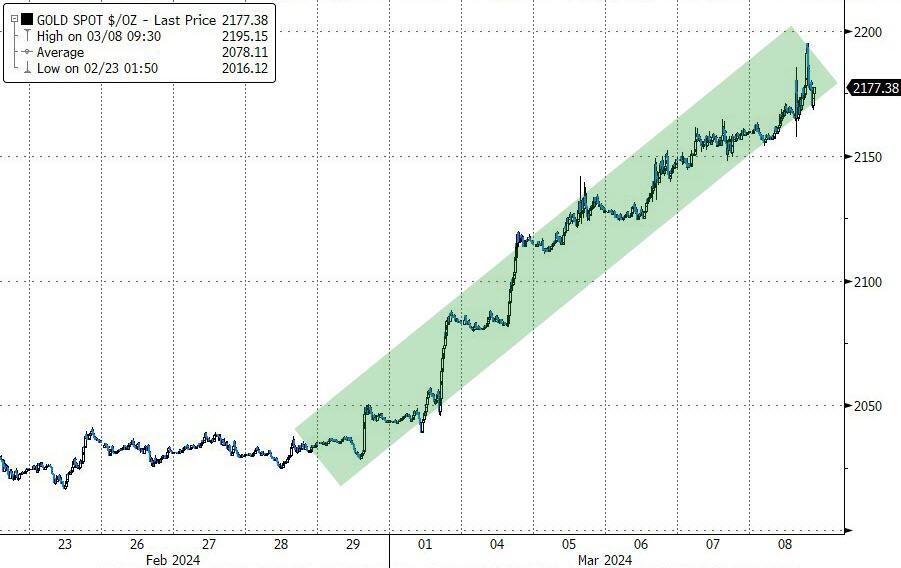
The dollar, on the other hand, felt like a punching bag, wrapping up its worst performance in three months. But every cloud has a silver—or should I say, gold—lining. The shiny metal gleamed brighter than a disco ball, hitting a new high just shy of $2.2k, celebrating its longest winning streak since the summer of ’20.
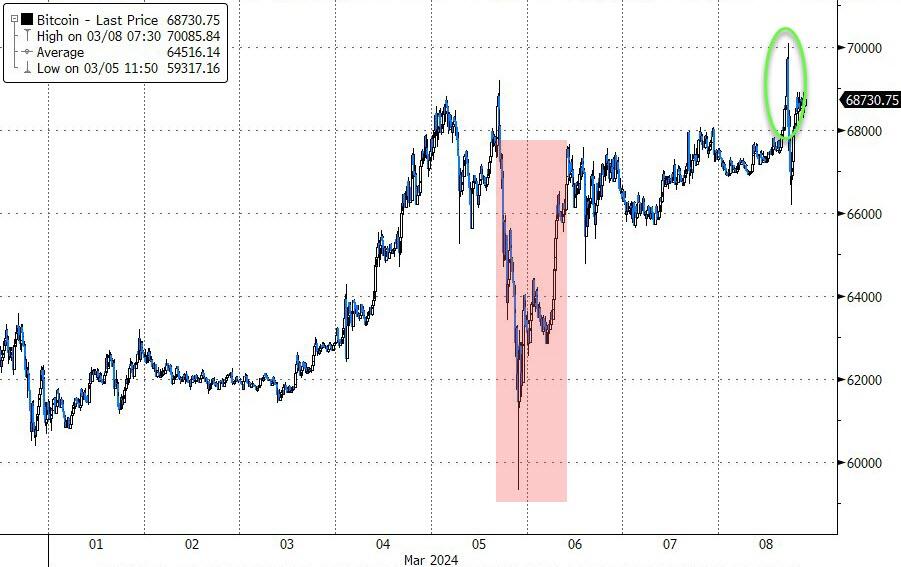
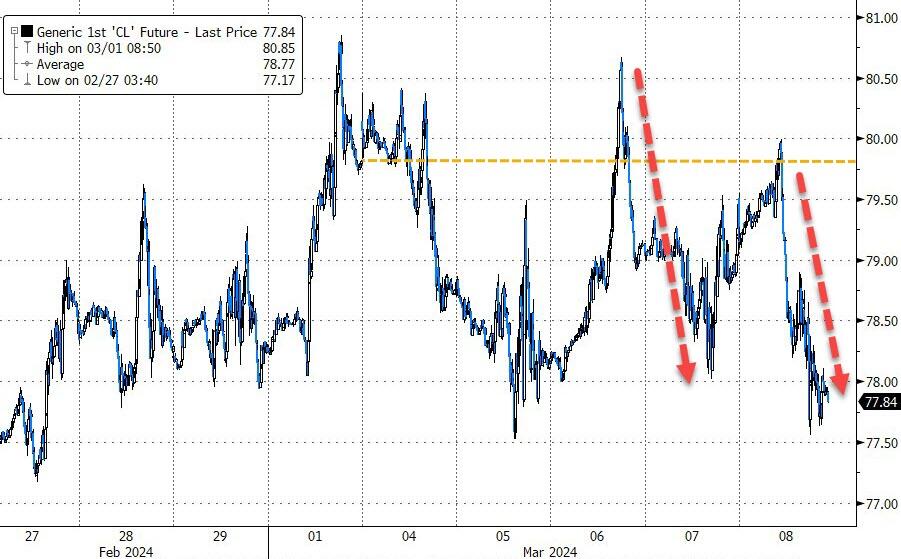
Cryptos, not to be outdone, partied hard this week, with Bitcoin breaking the $70k ceiling for a champagne-popping new record. Crude oil, however, couldn’t keep up with the festivities and took a dive by week’s end.
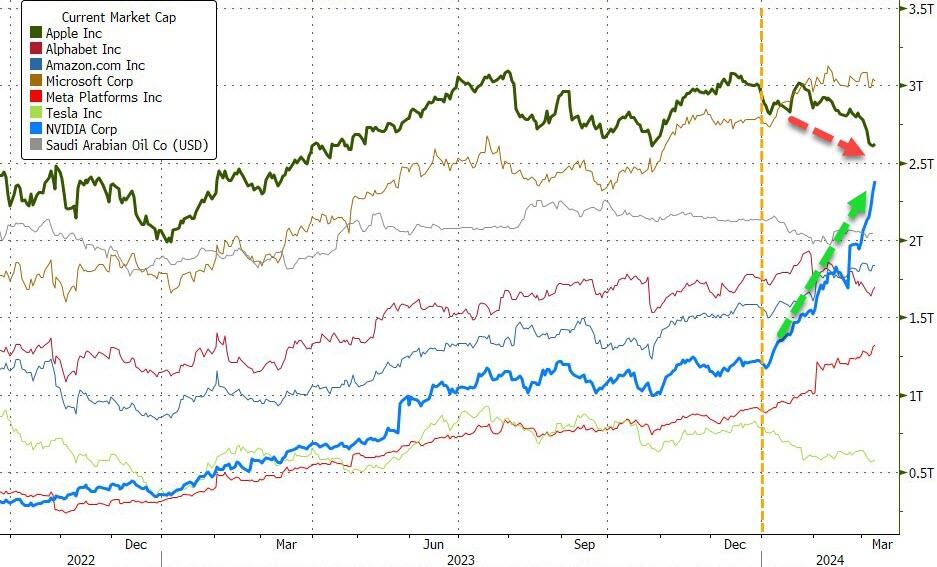
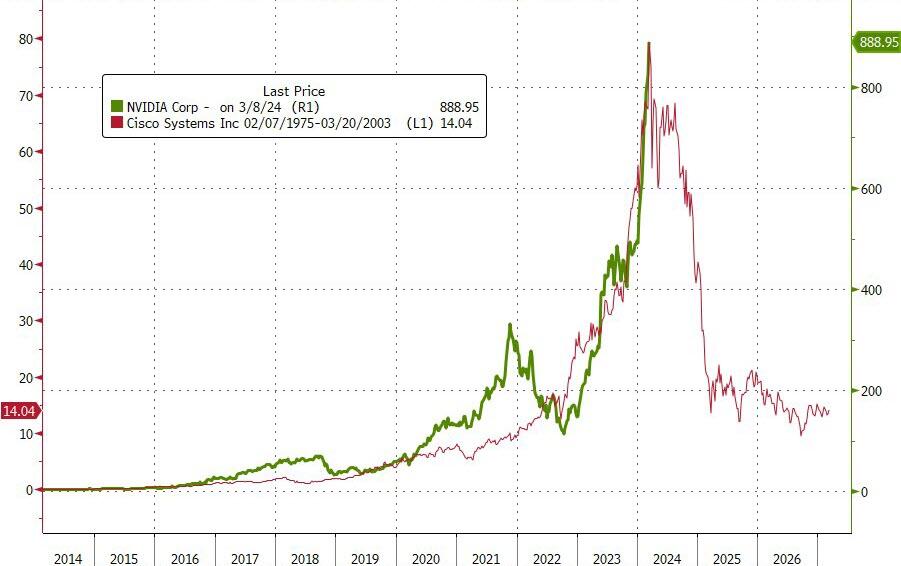
And as for Nvidia, it’s been stacking up market cap like a billionaire at a high-stakes poker game, adding a cool $1 trillion this year alone.
It begs the question: Is Nvidia the new Cisco, or is history just enjoying a good rerun?
2. Current “Buy” Cycles (effective 11/21/2023)
Our Trend Tracking Indexes (TTIs) have both crossed their trend lines with enough strength to trigger new “Buy” signals. That means, Tuesday, 11/21/2023, was the official date for these signals.
If you want to follow our strategy, you should first decide how much you want to invest based on your risk tolerance (percentage of allocation). Then, you should check my Thursday StatSheet and Saturday’s “ETFs on the Cutline” report for suitable ETFs to buy.
3. Trend Tracking Indexes (TTIs)
The stock market initially surged to record highs but encountered significant selling pressure, which caused the major indexes to reverse direction. They ultimately relinquished their earlier gains and closed with losses.
Similarly, our TTIs also experienced a downturn and finished the day lower.
This is how we closed 3/08/2024:
Domestic TTI: +10.41% above its M/A (prior close +11.38%)—Buy signal effective 11/21/2023.
International TTI: +9.83% above its M/A (prior close +10.69%)—Buy signal effective 11/21/2023.
All linked charts above are courtesy of Bloomberg via ZeroHedge.
———————————————————-
WOULD YOU LIKE TO HAVE YOUR INVESTMENTS PROFESSIONALLY MANAGED?
Do you have the time to follow our investment plans yourself? If you are a busy professional who would like to have his portfolio managed using our methodology, please contact me directly to get more details.
—————————————————————-
Contact Ulli