
- Moving the markets
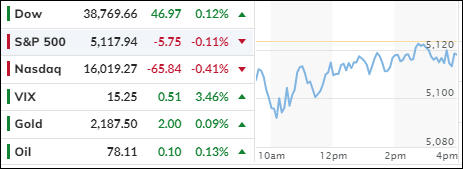
In the unpredictable world of Wall Street, stocks took a morning dive but didn’t forget their floaties, bobbing back up by closing time as the recent record-breaking rally decided to take a breather. Meanwhile, traders played a game of ‘hot potato’ with their portfolios, not wanting to get burned before tomorrow’s sizzling Consumer Price Index (CPI) data reveal.
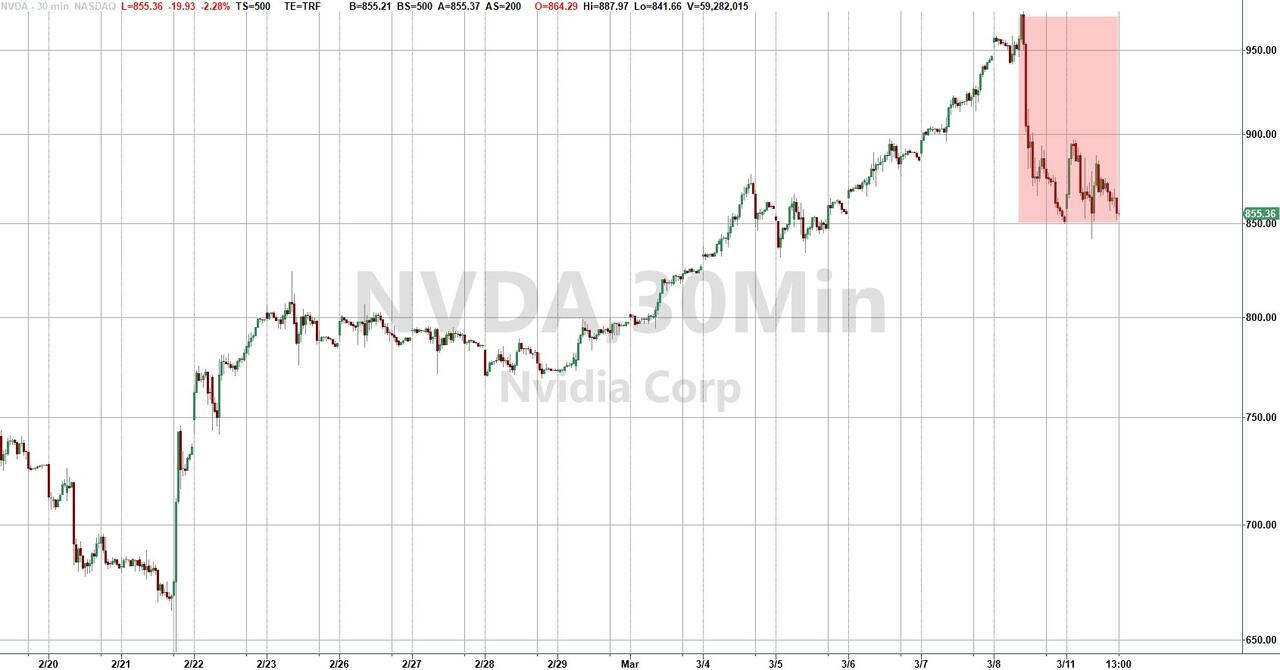
Tech titan Super Micro Computer felt a chill, dropping 7%, while Nvidia played ‘Red Light, Green Light’ with its stock price in a market that’s more jittery than a caffeinated squirrel. The big question on investors’ minds: Can AI stocks keep climbing, or have they reached their silicon peak?
As the CPI looms like a pop quiz on Tuesday, the Dow Jones’ pencil pushers predict a 0.4% month-over-month increase and a 3.1% year-over-year hike. When you strip away the unpredictable food and energy sectors, the core CPI is expected to tick up 0.3% for the month and 3.7% annually.
This financial foreplay sets the stage for the Producer Price Index (PPI) and Retail Sales data later in the week, all leading up to the Federal Reserve’s March policy meeting. Will the Fed play rate-cut fairy godmother in 2024, or will February’s inflation data be the cold shower that sobers up their rate reduction dreams?
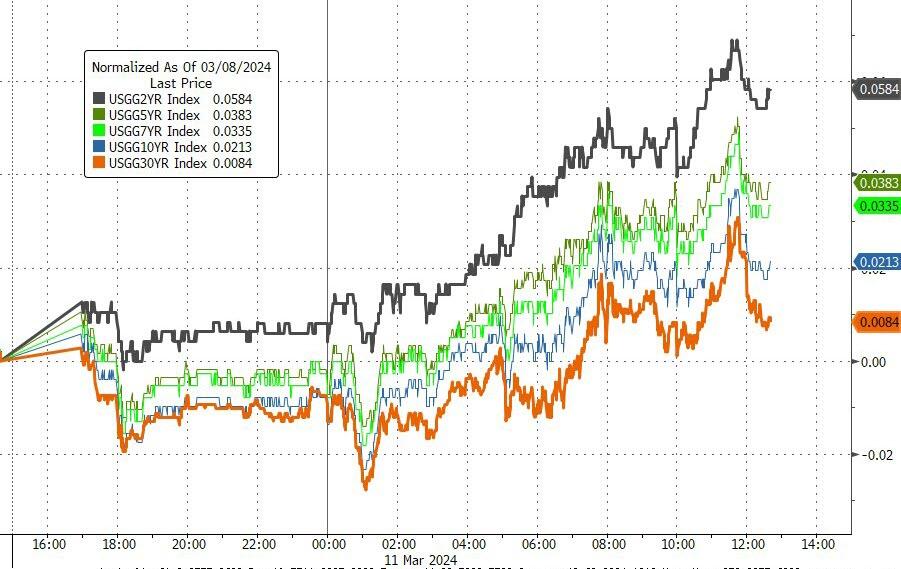
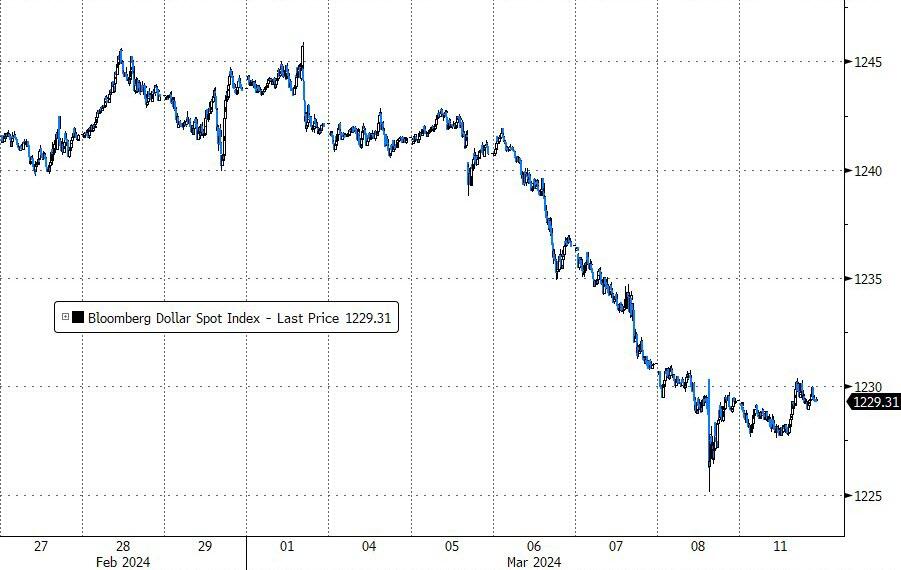
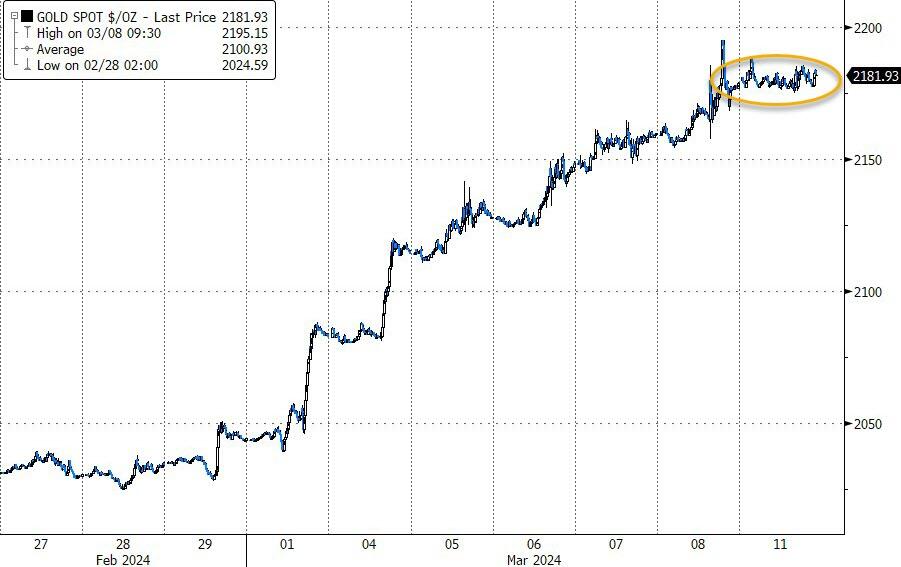
As the market holds its breath for the “most important data item in the whole wide world ever,” stocks tiptoed on thin ice, bond yields climbed the ladder, and the dollar and gold decided to play dead.
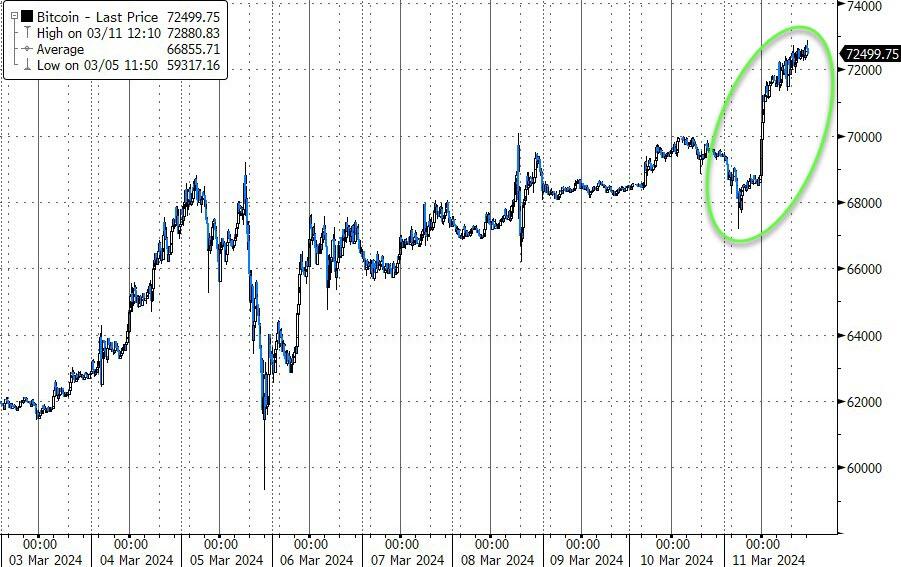
But crypto? It’s off to the races, with Bitcoin galloping to almost $73,000, leaving Nvidia in the dust, nursing an 8% tumble over two days and a 14% slide from its peak.
So, as we stand on the eve of the CPI showdown, one must wonder: Will tomorrow’s figures give the bulls a red cape to charge at, or will the bears get their honey pot?
2. Current “Buy” Cycles (effective 11/21/2023)
Our Trend Tracking Indexes (TTIs) have both crossed their trend lines with enough strength to trigger new “Buy” signals. That means, Tuesday, 11/21/2023, was the official date for these signals.
If you want to follow our strategy, you should first decide how much you want to invest based on your risk tolerance (percentage of allocation). Then, you should check my Thursday StatSheet and Saturday’s “ETFs on the Cutline” report for suitable ETFs to buy.
3. Trend Tracking Indexes (TTIs)
The markets experienced initial challenges but ultimately recouped most of their losses. Anticipation of tomorrow’s Consumer Price Index (CPI) figures led traders to hold off on establishing new positions.
Our Trend Tracking Indexes (TTIs) showed varied performance; the domestic index saw a slight increase, while the international index experienced a minor decline.
This is how we closed 3/11/2024:
Domestic TTI: +10.55% above its M/A (prior close +10.41%)—Buy signal effective 11/21/2023.
International TTI: +9.47% above its M/A (prior close +9.83%)—Buy signal effective 11/21/2023.
All linked charts above are courtesy of Bloomberg via ZeroHedge.
———————————————————-
WOULD YOU LIKE TO HAVE YOUR INVESTMENTS PROFESSIONALLY MANAGED?
Do you have the time to follow our investment plans yourself? If you are a busy professional who would like to have his portfolio managed using our methodology, please contact me directly to get more details.
—————————————————————-
Contact Ulli