
- Moving the markets
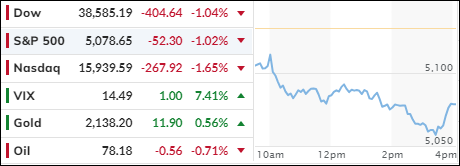
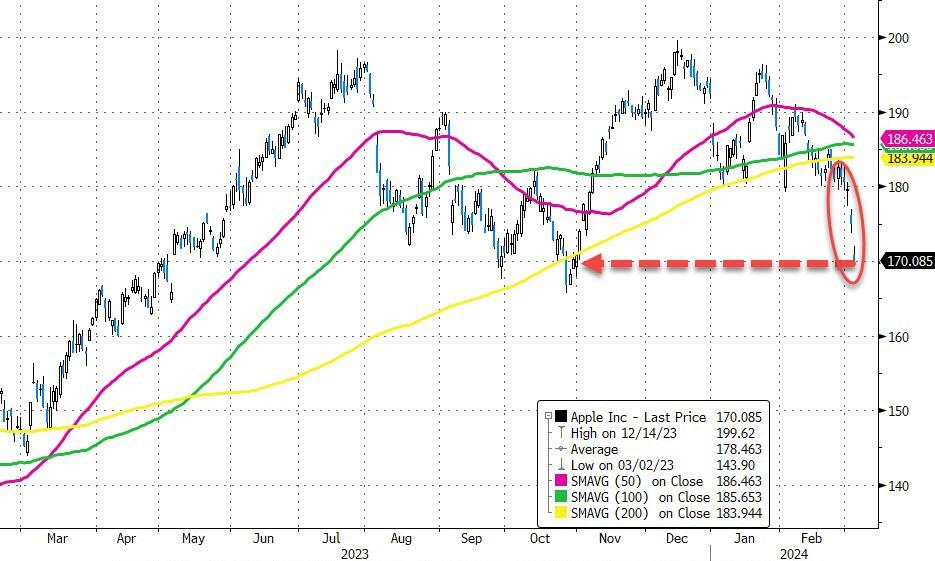
The U.S. stock market took another hit on Tuesday, as big tech stocks like Apple dragged it down further from its recent record highs. Apple lost almost 3% after a report showed that its iPhone sales tanked in China in the first six weeks of 2024.
Other tech giants such as Tesla, Netflix and Microsoft also fell more than 2%, pulling the S&P 500’s information technology sector down by more than 2%. The sector was the worst performer of the day.
The market’s slide came as traders took a breather from the rally that was fueled by excitement around artificial intelligence. Despite the losses, the three main stock indexes are still up for the year.
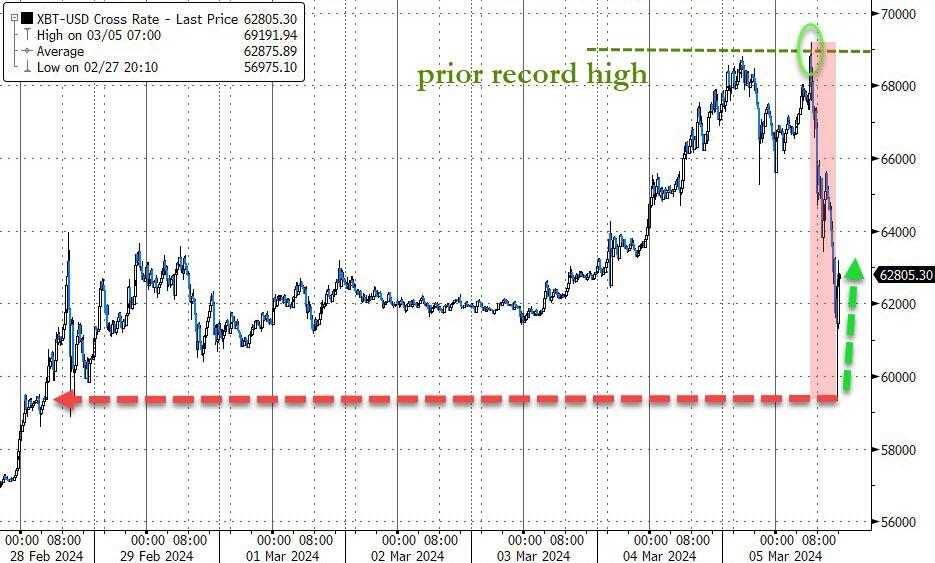
Bitcoin was the star of the show, hitting a new record high in the morning. But the party was short-lived, as the cryptocurrency quickly turned red after reaching the peak for the first time in two years.
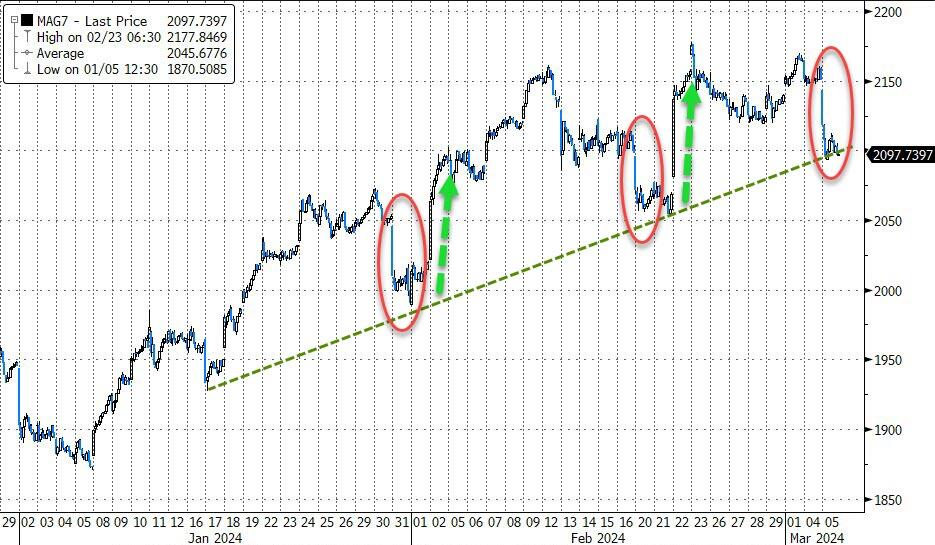
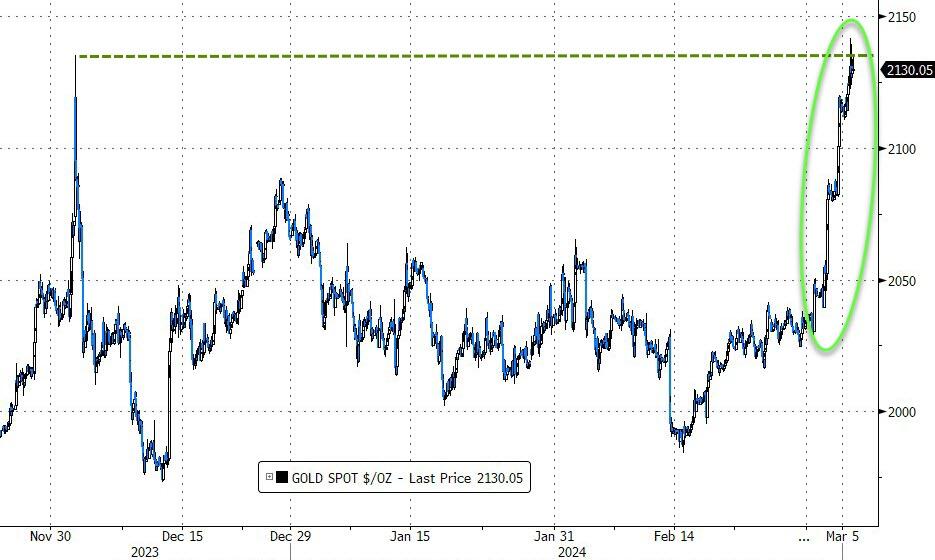
It was a roller-coaster day for traders, with highs (gold bulls cheered as the precious metal hit a new high), lows (bitcoin bulls cried as the digital coin reversed its gains), and crashes (Nasdaq and MAG7 stocks had their worst day since October).
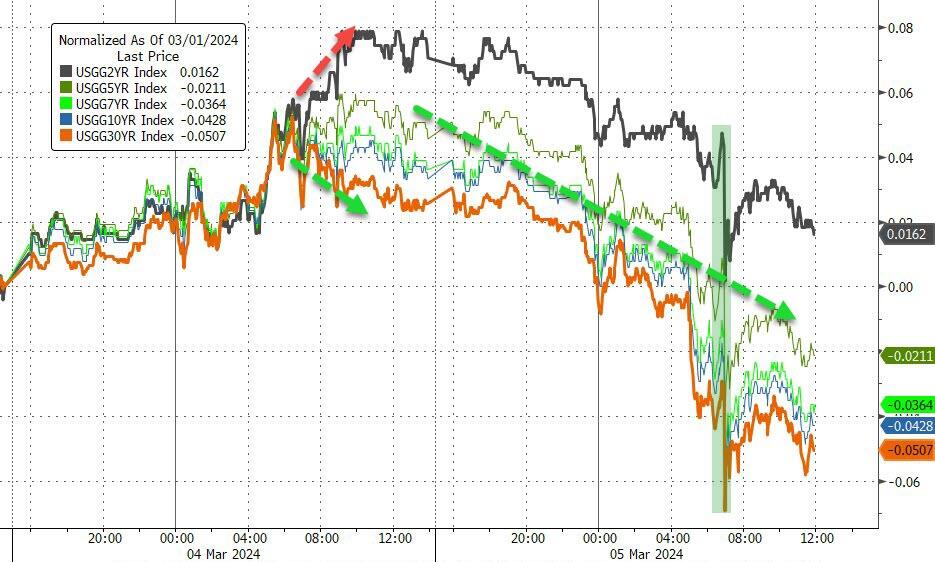
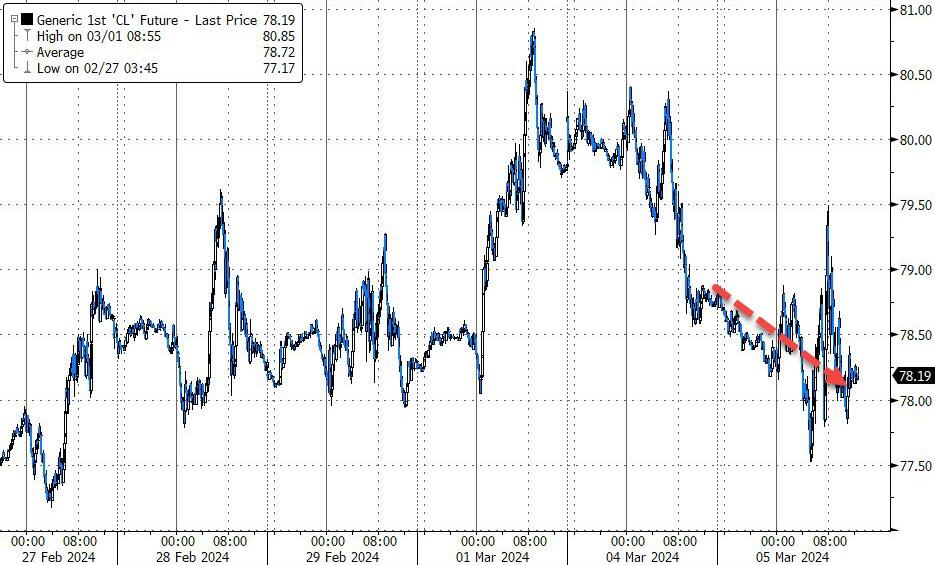
Bond yields dipped, the MAG7 stocks bounced off their trend line, Apple plunged to its October levels, but gold glittered by reaching a new high, while oil prices slid lower.
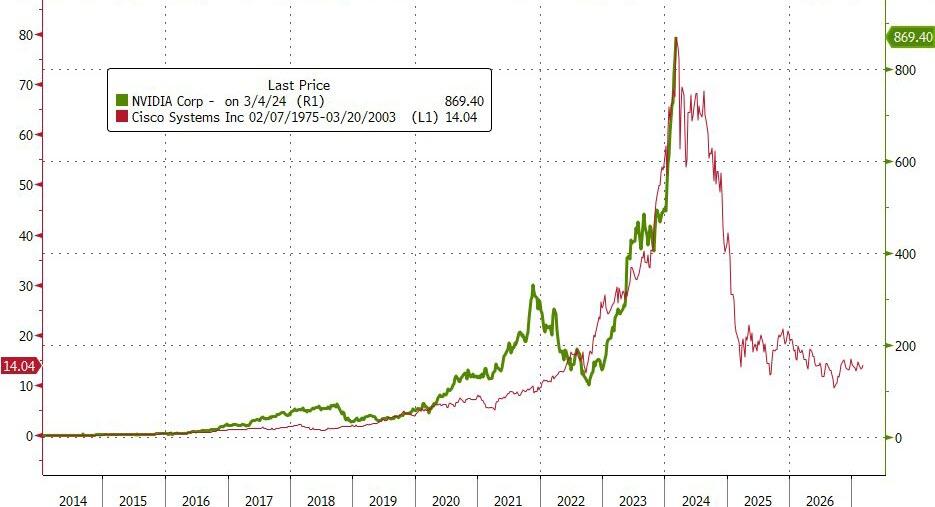
ZeroHedge summed it up: Be careful, if you compare Nvidia’s chart from 2020 to now with Cisco’s chart from 1996 to 2002, and zoom in in 2000, you’ll see a spooky similarity.
Coincidence or curse?
2. Current “Buy” Cycles (effective 11/21/2023)
Our Trend Tracking Indexes (TTIs) have both crossed their trend lines with enough strength to trigger new “Buy” signals. That means, Tuesday, 11/21/2023, was the official date for these signals.
If you want to follow our strategy, you should first decide how much you want to invest based on your risk tolerance (percentage of allocation). Then, you should check my Thursday StatSheet and Saturday’s “ETFs on the Cutline” report for suitable ETFs to buy.
3. Trend Tracking Indexes (TTIs)
The main stock market indicators continued to decline on Tuesday, extending their losses from Monday. Our TTIs, which measure the direction and strength of the market, also fell slightly.
This is how we closed 3/05/2024:
Domestic TTI: +9.87% above its M/A (prior close +10.39%)—Buy signal effective 11/21/2023.
International TTI: +9.11% above its M/A (prior close +9.37%)—Buy signal effective 11/21/2023.
All linked charts above are courtesy of Bloomberg via ZeroHedge.
———————————————————-
WOULD YOU LIKE TO HAVE YOUR INVESTMENTS PROFESSIONALLY MANAGED?
Do you have the time to follow our investment plans yourself? If you are a busy professional who would like to have his portfolio managed using our methodology, please contact me directly to get more details.
—————————————————————-
Contact Ulli