
- Moving the markets
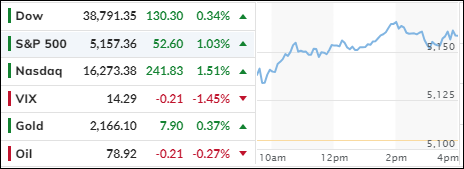
The stock market recovered some of its losses on Thursday, as investors cheered lower inflation forecasts from Europe and higher tech stocks. The European Central Bank cut its projections for inflation and growth for this year but kept its interest rates unchanged. This suggested that inflation was not a global threat.
The ECB’s decision followed the testimony of Federal Reserve Chair Jerome Powell, who said on Wednesday that he expected interest rates to fall this year, but that the Fed was not in a hurry to cut them. Powell’s words calmed the market’s nerves about rising inflation and interest rates.
Thursday’s rally added to Wednesday’s rebound, which was the first positive day of the week for the three main stock indexes. Despite the rough start to the week, the S&P 500 turned green for the week and was on track to have its 17th winning week out of the last 19 – the best run since 1964.
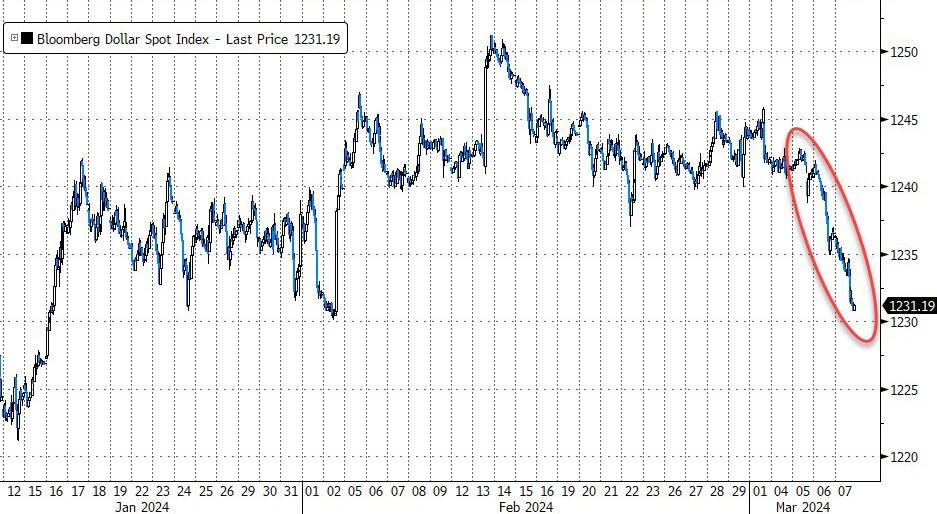
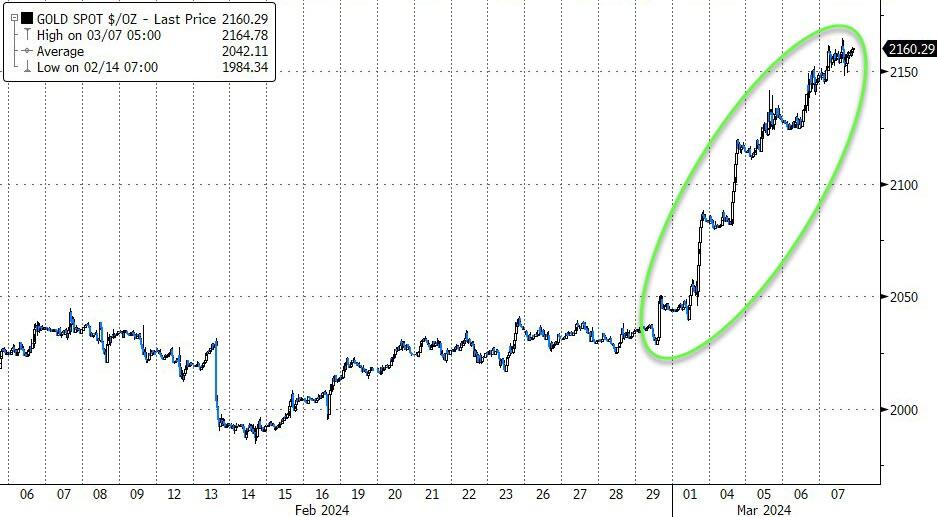
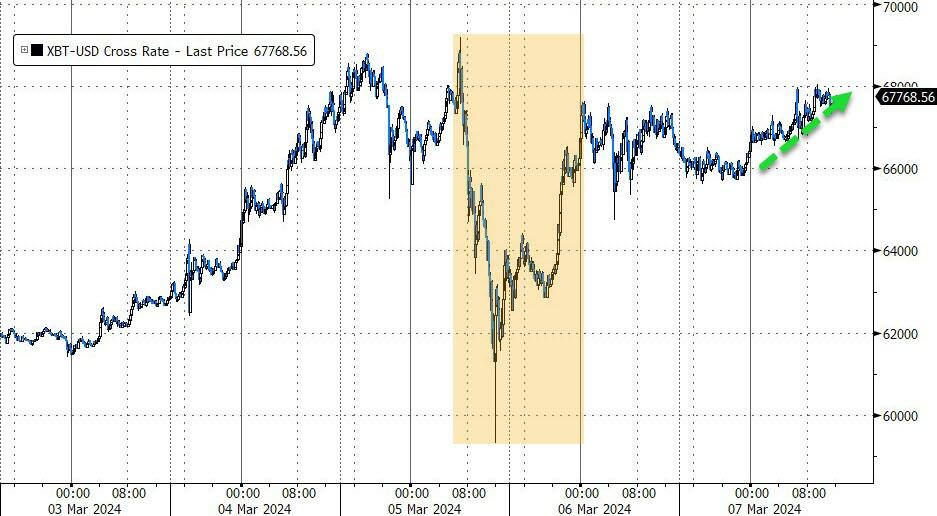
The dollar continued to slide and hit its lowest level since January 15th. It was the fifth consecutive day of losses and the biggest two-day drop since mid-December. As the dollar sank, everything else soared – stocks, bonds, bitcoin, and gold.
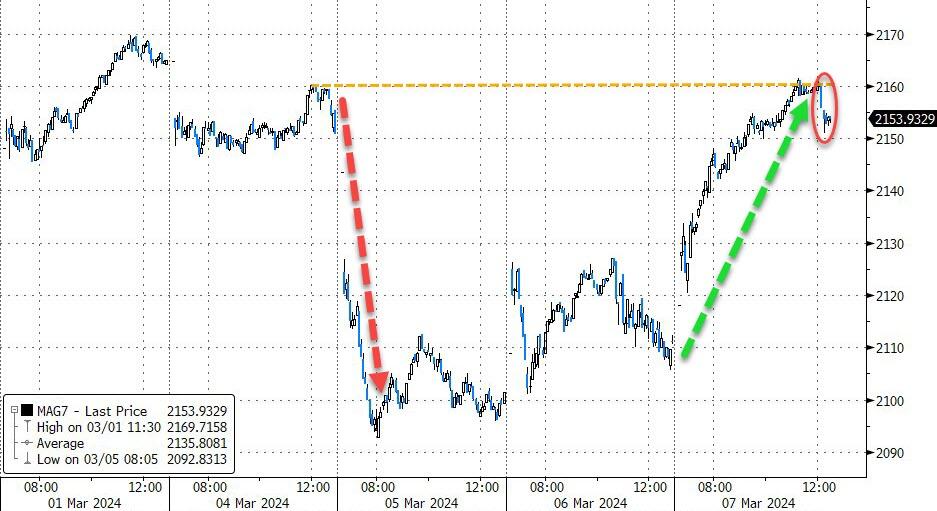
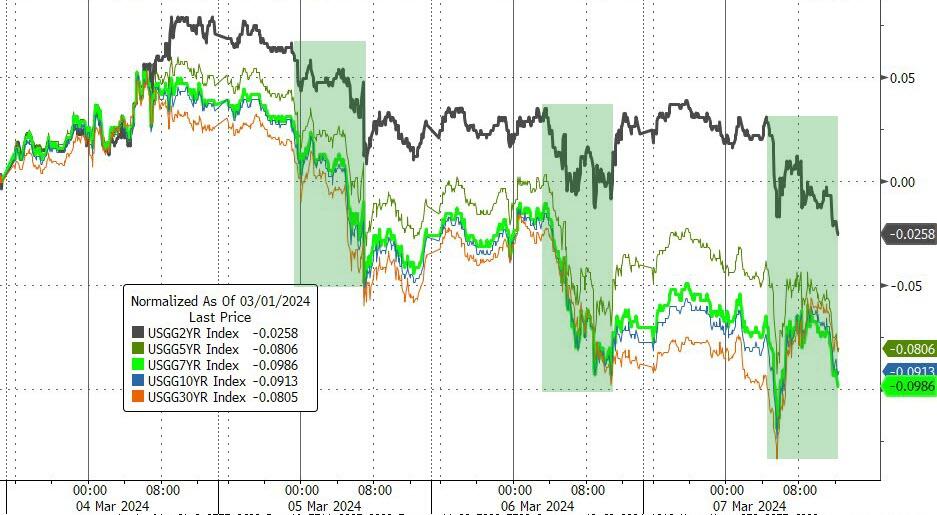
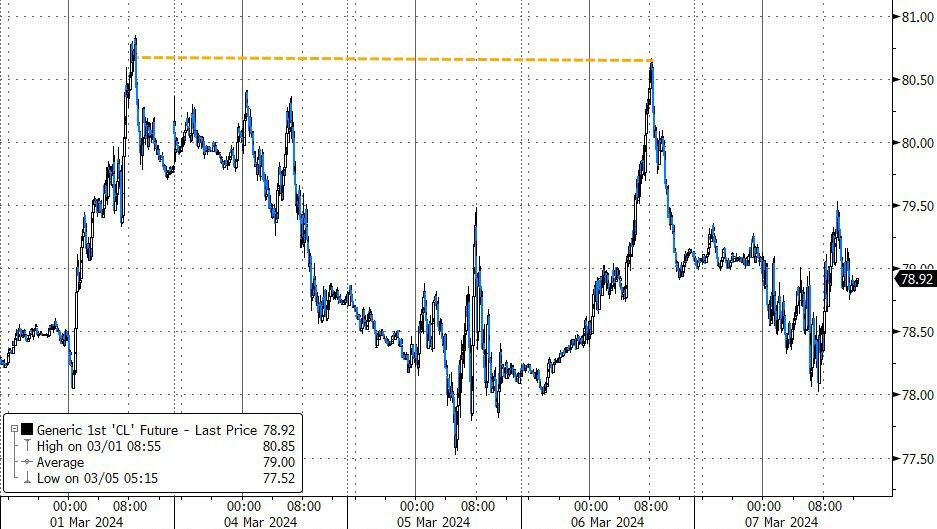
The MAG7 stocks bounced back from Tuesday’s slump, ahead of Friday’s jobs report. Bond yields fell, bitcoin rose to $68,000 and closed at a new record high. Oil prices moved sideways and ended the day flat.
Not everyone on Wall Street was happy about the market’s unstoppable optimism. JP Morgan’s trader Matt Reiner admitted this in a note to clients:
Today just feels… different. I have a feeling that we’re at the top of some mysterious turning point in the market. I can’t get rid of it.
Are the markets really at a tipping point?
2. Current “Buy” Cycles (effective 11/21/2023)
Our Trend Tracking Indexes (TTIs) have both crossed their trend lines with enough strength to trigger new “Buy” signals. That means, Tuesday, 11/21/2023, was the official date for these signals.
If you want to follow our strategy, you should first decide how much you want to invest based on your risk tolerance (percentage of allocation). Then, you should check my Thursday StatSheet and Saturday’s “ETFs on the Cutline” report for suitable ETFs to buy.
3. Trend Tracking Indexes (TTIs)
The market was optimistic and rose throughout the day, confirming our positive market outlook.
Our TTIs, which measure the direction and strength of the market, also increased and reached new highs.
This is how we closed 3/07/2024:
Domestic TTI: +11.38% above its M/A (prior close +10.51%)—Buy signal effective 11/21/2023.
International TTI: +10.69% above its M/A (prior close +9.88%)—Buy signal effective 11/21/2023.
All linked charts above are courtesy of Bloomberg via ZeroHedge.
———————————————————-
WOULD YOU LIKE TO HAVE YOUR INVESTMENTS PROFESSIONALLY MANAGED?
Do you have the time to follow our investment plans yourself? If you are a busy professional who would like to have his portfolio managed using our methodology, please contact me directly to get more details.
—————————————————————-
Contact Ulli