ETF/No Load Fund Tracker Newsletter For May 15, 2015
ETF/No Load Fund Tracker StatSheet
————————————————————-
THE LINK TO OUR CURRENT ETF/MUTUAL FUND STATSHEET IS:
————————————————————
Market Commentary
STOCKS END ON TOP TO CLOSE THE WEEK; NETFLIX STILL ATTRACTING INVESTORS

1. Moving the Markets
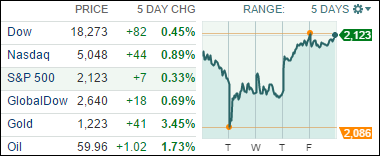
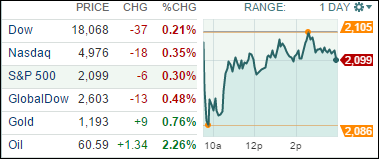
Stocks finished the week on the plus side, with the S&P 500 notching an all-time high. Most economic news came in slightly weaker than expected, which supported investor expectations for the Federal Reserve to remain patient in its approach to raising interest rates. Performance across sectors was mixed for the most part. Consumer staples and health care stocks were the strongest upward movers on the week, while energy moved lower.
As earnings season continues to wind down, Netflix (NFLX) was one of the largest gainers since reporting. Shares of the video streaming service are up $25.51, or 4.4% on the year and now rest at a price of $612.21 a share. Netflix is now among the five stocks with the very highest per-share prices of $600 or more. The stock is also seeing gains on rumors of expansion. The company reported a quarterly profit of 77 cents a share, beating expectations by 22%.
As for the economy thus far in 2015, the pace of economic growth in the U.S. has gotten off to a soft start. Many analysts expect the economy to regain momentum though as the year unfolds, and U.S. growth expectations remain above average when compared with developed economies around the globe. Next week, housing starts and building permits will be released on Tuesday, while the Federal Reserve’s latest meeting minutes will be released on Wednesday. Thursday brings existing home sales and the leading economic indicators index, while the consumer price index will be released on Friday.
8 of our 10 ETFs in the Spotlight managed to close higher today with consumer discretionaries (XLY) taking the lead at +0.80%. The loser of the day was the financial sector (IYF), which surrendered 0.41%.
2. ETFs in the Spotlight
In case you missed the announcement and description of this section, you can read it here again.
It features 10 broadly diversified ETFs from my HighVolume list as posted every Monday. Furthermore, they are screened for the lowest MaxDD% number meaning they have been showing better resistance to temporary sell offs than all others over the past year.
Here are the 10 candidates:
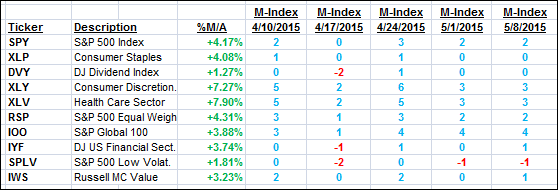
The above table simply demonstrates the magnitude with which some of the ETFs are fluctuating in regards to their positions above or below their respective individual trend lines (%M/A). A break below, represented by a negative number, shows weakness, while a break above, represented by a positive percentage, shows strength.
For hundreds of ETF/Mutual fund choices, be sure to reference Thursday’s StatSheet.
Year to date, here’s how the above candidates have fared so far:
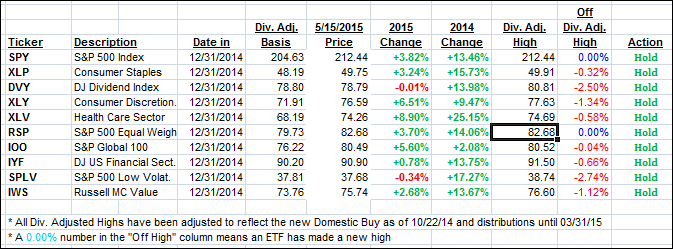
Again, the first table above shows the position of the various ETFs in relation to their respective long term trend lines (%M/A), while the second one tracks their trailing sell stops in the “Off High” column. The “Action” column will signal a “Sell” once the -7.5% point has been taken out in the “Off High” column.
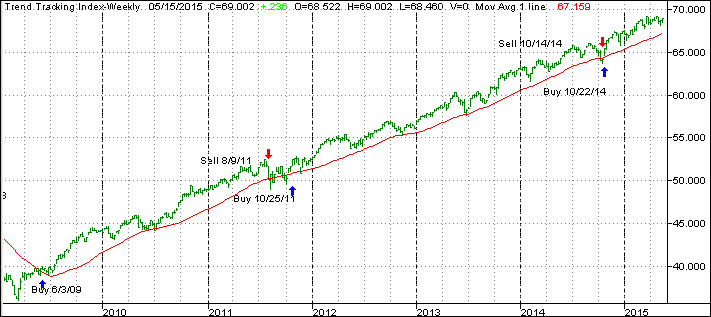
3. Trend Tracking Indexes (TTIs)
Our Trend Tracking Indexes (TTIs) closed up from last week’s level:
Domestic TTI: +2.85% (last Friday +2.54%)—Buy signal effective 10/22/2014
International TTI: +5.63% (last Friday +5.07%)—Buy signal effective 2/13/2015
Have a nice weekend.
Ulli…
Disclosure: I am obliged to inform you that I, as well as advisory clients of mine, own some of these listed ETFs. Furthermore, they do not represent a specific investment recommendation for you, they merely show which ETFs from the universe I track are falling within the guidelines specified.
————————————————————-
READER Q & A FOR THE WEEK
All Reader Q & A’s are listed at our web site!
Check it out at:
http://www.successful-investment.com/q&a.php
———————————————————-
WOULD YOU LIKE TO HAVE YOUR INVESTMENTS PROFESSIONALLY MANAGED?
Do you have the time to follow our investment plans yourself? If you are a busy professional who would like to have his portfolio managed using our methodology, please contact me directly or get more details at:
https://theetfbully.com/personal-investment-management/
———————————————————
Back issues of the ETF/No Load Fund Tracker are available on the web at: