
1. Moving the Markets
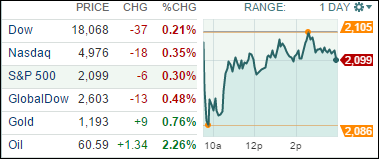
Major U.S. stock indexes closed slightly lower after recouping much of an early slump. The slide was brought on, in part, by a troubling rise in global long-term borrowing rates. The price of oil closed above $60 a barrel for just the third time this year, giving a boost to energy stocks.
One of the major news stories today was that Verizon (VZ) is going to buy AOL (AOL) for $4.4 billion. The strategy behind the acquisition is mostly related to AOL’s advertising platform that will allow Verizon to advertise across mobile and broadband services. Verizon is offering $50 a share for AOL, which is 17% more than AOL’s closing price Monday. AOL closed at $50.52, up almost 19% Tuesday. Verizon finished at $49.62, down less than 1%.
In economic news, the Department of Labor reported that job postings dropped 2.9% in March while total hiring increased by 1.1% — the most since December. U.S. Treasuries rallied today to close higher after early morning losses. Let’s see if the bears will go crawl back into their caves as the week progresses.
All of our 10 ETFs in the Spotlight headed south with XLV losing 0.64%, while IWS held up best by giving back only 0.17%.
2. ETFs in the Spotlight
In case you missed the announcement and description of this section, you can read it here again.
It features 10 broadly diversified ETFs from my HighVolume list as posted every Monday. Furthermore, they are screened for the lowest MaxDD% number meaning they have been showing better resistance to temporary sell offs than all others over the past year.
Here are the 10 candidates:
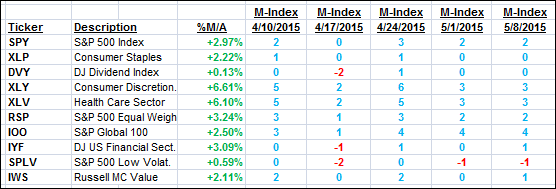
The above table simply demonstrates the magnitude with which some of the ETFs are fluctuating in regards to their positions above or below their respective individual trend lines (%M/A). A break below, represented by a negative number, shows weakness, while a break above, represented by a positive percentage, shows strength.
For hundreds of ETF/Mutual fund choices, be sure to reference Thursday’s StatSheet.
Year to date, here’s how the above candidates have fared so far:
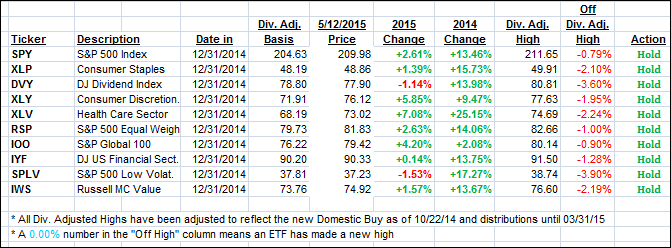
Again, the first table above shows the position of the various ETFs in relation to their respective long term trend lines (%M/A), while the second one tracks their trailing sell stops in the “Off High” column. The “Action” column will signal a “Sell” once the -7.5% point has been taken out in the “Off High” column.
3. Trend Tracking Indexes (TTIs)
Our Trend Tracking Indexes (TTIs) both slipped a tad, which did not affect our current bullish stance.Here’s how we closed:
Domestic TTI: +2.09% (last close +2.18%)—Buy signal effective 10/22/2014
International TTI: +4.45% (last close +4.80%)—Buy signal effective 2/13/2015
Disclosure: I am obliged to inform you that I, as well as advisory clients of mine, own some of these listed ETFs. Furthermore, they do not represent a specific investment recommendation for you, they merely show which ETFs from the universe I track are falling within the guidelines specified.
Contact Ulli