ETF/No Load Fund Tracker Newsletter For May 22, 2015
ETF/No Load Fund Tracker StatSheet
————————————————————-
THE LINK TO OUR CURRENT ETF/MUTUAL FUND STATSHEET IS:
https://theetfbully.com/2015/05/weekly-statsheet-for-the-etfno-load-fund-tracker-newsletter-updated-through-05212015/
————————————————————
Market Commentary
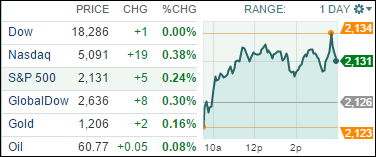
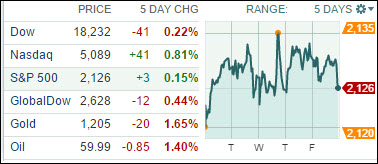
MARKETS CLOSE LOWER FRIDAY, BUT ROUND OUT A SOLID WEEK
[Chart courtesy of MarketWatch.com]
1. Moving the Markets
Stocks ended lower ahead of the Memorial Day holiday weekend as Fed Reserve Chair Janet Yellen reconfirmed that the central bank remains on track to raise interest rates this year.
Today, in the release of the minutes of its April 28-29 meeting, the Fed suggested that it was “unlikely” that they would hike rates in June. Financial markets began speculating the Fed would delay a rate hike given the weak spate of economic data that has been released recently.
Although Friday stocks ended lower, markets finished the week higher, reaching a fresh all-time high on Thursday. Performance across sectors was mixed as well. Telecom and health care stocks were the strongest upward movers, while energy and materials moved lower.
Markets will be closed on Monday for Memorial day, however, the week will start with a busy Tuesday, with durable goods orders, the Case-Shiller house price index, new home sales, and consumer confidence all being released. Weekly jobless claims and pending home sales will both be released on Thursday.
All of our 10 ETFs in the Spotlight slipped today with the Financials (IYF) holding up the best with a tiny 0.03% loss, while the Global 100 (IOO) fared the worst by giving back 0.57%.
2. ETFs in the Spotlight
In case you missed the announcement and description of this section, you can read it here again.
It features 10 broadly diversified ETFs from my HighVolume list as posted every Monday. Furthermore, they are screened for the lowest MaxDD% number meaning they have been showing better resistance to temporary sell offs than all others over the past year.
Here are the 10 candidates:
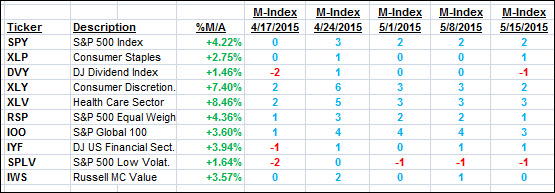
The above table simply demonstrates the magnitude with which some of the ETFs are fluctuating in regards to their positions above or below their respective individual trend lines (%M/A). A break below, represented by a negative number, shows weakness, while a break above, represented by a positive percentage, shows strength.
For hundreds of ETF/Mutual fund choices, be sure to reference Thursday’s StatSheet.
Year to date, here’s how the above candidates have fared so far:
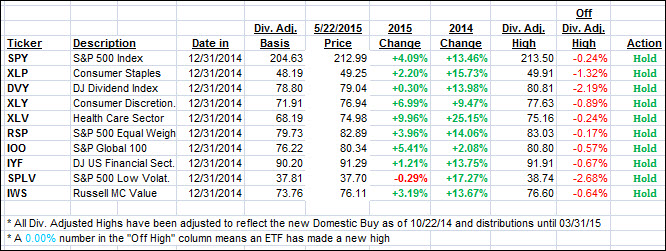
Again, the first table above shows the position of the various ETFs in relation to their respective long term trend lines (%M/A), while the second one tracks their trailing sell stops in the “Off High” column. The “Action” column will signal a “Sell” once the -7.5% point has been taken out in the “Off High” column.
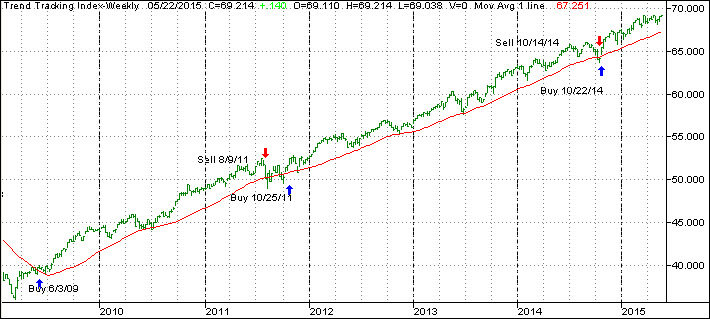
3. Trend Tracking Indexes (TTIs)
Our Trend Tracking Indexes (TTIs) clanged only slightly from last week:
Domestic TTI: +2.77% (last Friday +2.85%)—Buy signal effective 10/22/2014
International TTI: +5.25% (last Friday +5.63%)—Buy signal effective 2/13/2015
Have a nice weekend.
Ulli…
Disclosure: I am obliged to inform you that I, as well as advisory clients of mine, own some of these listed ETFs. Furthermore, they do not represent a specific investment recommendation for you, they merely show which ETFs from the universe I track are falling within the guidelines specified.
————————————————————-
READER Q & A FOR THE WEEK
Reader Ed:
Q: Ulli: I’m just wondering how you place your trailing stop orders. I had a weird thing happen to me yesterday. I had a 7% trailing stop loss on IPGP on the bid. It has been trading around $95.00. The trigger price for the stop was $ 90.09, but I was stopped out @ $95.17.
I called Fidelity; they researched it & told me there were a couple of bids in before the opening at approx. my stop price of $90.09. This triggered the stop and Fidelity routed it to the best price… which was $95.17. They said it was unusual but it sometimes happens… The problem is I still want to be in the stock.
My question: Should I place my trailing stop losses on the last price instead of the bid? All of my ETFs have trailing stop losses on the bid which I thought was the correct way to do it. I have changed some of my stock stop losses to last price since this happened. I’d appreciate any advice.
A: Ed: It’s nice to hear from you. 7% stops on stocks don’t work well due to the volatility. I only use the 7% rule on ETFs/Mutual funds. Personally, I don’t put in the stop ahead of time (I track it on my spreadsheet), because I only use day ending prices to avoid what happened to you, namely market manipulation and/or front running by the HFTs. If my stop has been triggered based on the day-ending price, only then will I enter the “sell” the next day as a limit order.
When using day ending prices for stops, you may get stopped out at worse price, but I am not interested in intra-day fluctuations but only how the markets end up once trading is over. That way I can better determine if the long-term trend, the basis for Trend Tracking, remains intact or not.
All Reader Q & A’s are listed at our web site!
Check it out at:
http://www.successful-investment.com/q&a.php
———————————————————-
WOULD YOU LIKE TO HAVE YOUR INVESTMENTS PROFESSIONALLY MANAGED?
Do you have the time to follow our investment plans yourself? If you are a busy professional who would like to have his portfolio managed using our methodology, please contact me directly or get more details at:
https://theetfbully.com/personal-investment-management/
———————————————————
Back issues of the ETF/No Load Fund Tracker are available on the web at:
https://theetfbully.com/newsletter-archives/