ETF/No Load Fund Tracker Newsletter For May 29, 2015

Ulli ETF Tracker Contact

ETF/No Load Fund Tracker StatSheet

————————————————————-

THE LINK TO OUR CURRENT ETF/MUTUAL FUND STATSHEET IS:

https://theetfbully.com/2015/05/weekly-statsheet-for-the-etfno-load-fund-tracker-newsletter-updated-through-05282015/

————————————————————

Market Commentary

STOCKS LOWER FRIDAY, BUT NOT TO OVERSHADOW PROFITABLE MONTH OF MAY

Fri pic

[Chart courtesy of MarketWatch.com]

1. Moving the Markets

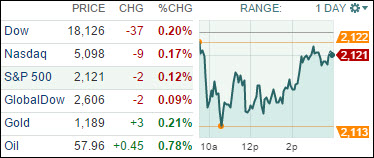
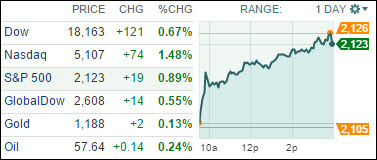
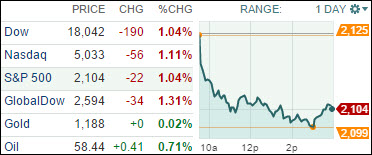
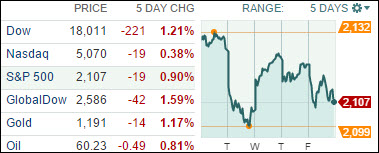
Stocks fell Friday; the major indexes posted weekly losses as weaker economic data weighed on markets. But equities still notched gains for the month, with the Nasdaq getting a 2.6% boost while the Dow and S&P 500 climbed 1% each. On the week, nine of the ten S&P sectors were lower with industrials and financials posting the largest losses. Only energy stocks were higher as oil prices jumped as U.S. supplies declined more than expected. U.S. benchmark crude rose about 3% to $59.65 a barrel.

To recap major M&A news this week, Charter Communications (CHTR) has agreed to buy Time Warner Cable (TWC) for $55 billion in cash and stock, valuing the company at $78.7 billion, including debt. The deal would combine the second- and third-largest US cable companies to better compete against the market leader Comcast, and has raised the scrutiny of the Federal Communications Commission. We also heard that Singapore’s Avago Technologies (AVGO) will buy California-based Broadcom (BRCM), creating the world’s sixth largest chipmaker by revenue in the industry’s largest acquisition.

It will be interesting to see, as we head into June, if the indexes can continue upward on a monthly basis. Next week, we will hear some economic data that could move markets, notable the ISM manufacturing PMI for the U.S. and the European Union reports preliminary Q1 GDP growth on Friday, June 5th.

All of our 10 ETFs in the Spotlight retreated today with Healthcare (XLV) holding up best with a small loss of 0.25%, while the Financials (IYF) fared the worst by surrendering 0.88%.

Read More

Weekly StatSheet For The ETF/No Load Fund Tracker Newsletter – Updated Through 05/28/2015

Ulli ETF StatSheet Contact

ETF/Mutual Fund Data updated through Thursday, May 28, 2015

TOC021915

If you are not familiar with some of the terminology used, please see the Glossary of Terms.


1. DOMESTIC EQUITY MUTUAL FUNDS/ETFs: BUY — since 10/22/2014

TTI

Our main directional indicator, the Domestic Trend Tracking Index (TTI), broke through its long-term trend line generating a “Sell” for this arena effective 10/14/2014, which was followed by a violent break back above the line on 10/22/14 generating a new “Buy.” It was a classic whipsaw signal, and you can read more on my blog as to the events as they were unfolding.

As of today, our TTI (green line in above chart) is positioned above its long term trend line (red) by +2.75% keeping us in the market with our established positions.

Read More

U.S. Investors Just Can’t Get Away From Greek Food; Semiconductor M&A Bigtime

Ulli Market Commentary Contact

Thur pic

[Chart courtesy of MarketWatch.com]

1. Moving the Markets

U.S. stocks closed lower today as uneasiness over a Greek debt deal and a selloff in Shanghai stocks weighed on investor sentiment. In China, stocks fell 6.5% on Thursday, with traders citing the tightening of marginal lending rules as a possible explanation. In economic news, jobless claims rose unexpectedly last week, but remained at levels consistent with a strengthening labor market. U.S. bonds finished mixed for the day.

In M&A news, Chipmaker Avago Technologies (AVGO) Thursday announced plans to buy rival Broadcom (BRCM) in a $37 billion cash and stock deal marking the latest consolidation of firms that supply parts for smartphones and other tech products. One of Avago’s representatives said today that, post-acquisition, the company will have the most diversified communications platform in the semiconductor industry that entails combined annual revenues of about $15 billion.

Moving on to the agricultural sector, we heard some news today that might come as a bit of a surprise to you. Apparently, Amazon (AMZN) is expanding the grocery business by broadening its private-label brand, Elements, into food items, according to a report by The Wall Street Journal. Amazon has apparently approached several food manufacturers to partner in the plans.

8 of our 10 ETFs in the Spotlight closed lower led by RSP with a small loss of 0.18%. Leading the upside was iShares Select Dividend (DVY) with a modest gain of 0.13%.

Read More

Equities Rally On Greek Hopes

Ulli Market Commentary Contact

Wed pic

[Chart courtesy of MarketWatch.com]

1. Moving the Markets

In an abrupt reversal from yesterday’s pullback, the markets shifted into high gear and never looked back, as reports of alleged positive debt negotiations in Greece proved to be a sufficient driver to overcome the bearish crowd and recoup some of the losses. The main beneficiary was the Nasdaq which saw enough positive momentum to close at an all-time high.

Despite denials from various sources that a Greek deal was not imminent, it did not matter, the trend was up and nothing was going to interfere with the indexes making up some of the losses. Of course, it remains to be seen what market reaction will be, should negotiations end in disappointment.

All of our 10 ETFs in the Spotlight did an about face and closed up. Leading the group was Healthcare (XLV) with a gain of 1.16%, while iShares Select Dividends (DVY) lagged but still rallied 0.52%.

Read More

Stocks Lag After Holiday Weekend

Ulli Market Commentary Contact

Tue pic

[Chart courtesy of MarketWatch.com]

1. Moving the Markets

Well, I hope your holiday was enjoyable, because today was not for most investors. The Dow tumbled sharply and posted its worst day in May as a stronger U.S. dollar and mixed economic data rattled investors. The downturn was broad-based as all 10 of the S&P 500 sectors were lower and all 30 Dow stocks dropped.

In M&A news, Charter Communications (CHTR) said today that it is buying Time Warner Cable (TWC) for $55.3 billion, forging ahead with its theory that broadening its presence nationally would provide the leverage it needs to fend off the challenges in the turbulent pay-TV industry. After completing the deal, Charter will have about 27 million customers in 41 states, trailing only Comcast (CCV). Charter will pay $195.71 per share in the cash-and-stock deal — $100 of it in cash with the rest in Charter shares. The offer is based on Charter’s 60-trading day volume weighted average price.

In economic news, a manufacturing report provided mixed data as orders for durable goods orders dropped 0.5% in April but orders in the key business investment category gained 1%. Also, the housing market continued to show signs of improvement as home prices rose faster than expected in March and new home sales in April rose 6.8%.

All of our 10 ETFs in the Spotlight headed down that slippery slope and closed lower. The Global 100 (IOO) showed the worst performance with a loss of 1.63%, while Consumer Discretionaries (XLY) held up best by giving back only 0.71%.

Read More

ETFs/Mutual Funds On The Cutline – Updated Through 05/22/2015

Ulli ETFs on the Cutline Contact

Below are the latest ETF Cutline reports, which show how far above or below their respective long-term trend lines (39 week SMA) my currently tracked ETFs/MFs are positioned.

The first report covers the ETF Master List from Thursday’s StatSheet and includes 410 ETFs, of which currently 303 (last week 326) are hovering in bullish territory.

The second report includes only High Volume ETFs. To clarify, High Volume (HV) ETFs are defined as those with an average daily volume of $10 million or higher.

These ETFs are generated from my selected list of some 97 that I use in my advisor practice. It cuts out the “noise,” which simply means it eliminates those ETFs that I would never buy because of their volume limitations. 55 ETFs (last week 62) have managed to remain in bullish territory after the recent market volatility.

The third report covers Mutual Funds on the Cutline. There are currently 592 (last week 581) above the line and 228 below it out of the 820 that I follow.

Take a look:

1. ETF Master Cutline Report

2. ETF High Volume Cutline Report

3. MF Cutline Report

In case you are not familiar with some of the terminology used in the reports, please read the Glossary of Terms.

If you missed the original post about the Cutline approach, you can read it here.