
1. Moving the Markets
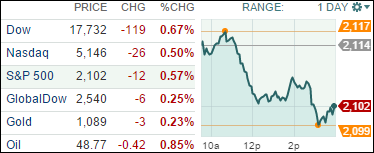
Equities hit he skids for the 3rd day in a row as, following Apple’s disappointing report card yesterday, 3M and Caterpillar joined the crowd, and the slide in stocks continued killing any hope of a rebound. Commodities offered little help as they seem to be stuck in a bearish trend of their own.
In the case of Caterpillar, international sales have been unimpressive due to the pricing slump in coal, iron ore and copper. Not helping matters has been the hard hit energy industry where oil and gas prices continue their path south, so new heavy duty equipment has not been needed.
And as always, any and all economic reports are being scrutinized for any clues as to when the widely expected rise in interest will actually happen. According to the latest, the Fed is supposed to finally pull the trigger this coming September, but, the odds are only put at 50%.
All of our 10 ETFs in the Spotlight joined the major indexes and headed lower. Resisting the sell-off the best was Healthcare (XLV), which gave back -0.34%, while the Financials (IYF) showed the most weakness by surrendering -0.83%.
2. ETFs in the Spotlight
In case you missed the announcement and description of this section, you can read it here again.
It features 10 broadly diversified ETFs from my HighVolume list as posted every Monday. Furthermore, they are screened for the lowest MaxDD% number meaning they have been showing better resistance to temporary sell offs than all others over the past year.
Here are the 10 candidates:
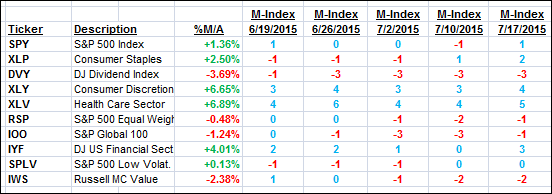
The above table simply demonstrates the magnitude with which some of the ETFs are fluctuating in regards to their positions above or below their respective individual trend lines (%M/A). A break below, represented by a negative number, shows weakness, while a break above, represented by a positive percentage, shows strength.
For hundreds of ETF/Mutual fund choices, be sure to reference Thursday’s StatSheet.
Year to date, here’s how the above candidates have fared so far:
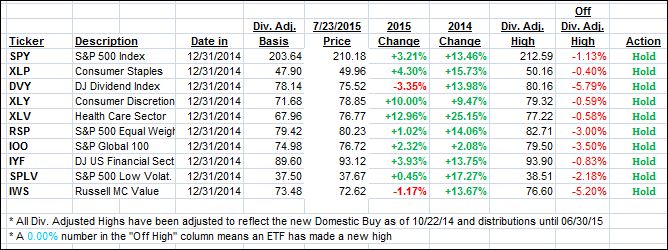
Again, the first table above shows the position of the various ETFs in relation to their respective long term trend lines (%M/A), while the second one tracks their trailing sell stops in the “Off High” column. The “Action” column will signal a “Sell” once the -7.5% point has been taken out in the “Off High” column.
3. Trend Tracking Indexes (TTIs)
Our Trend Tracking Indexes (TTIs) slipped again but remain bullish:
Domestic TTI: +1.37% (last close +1.60%)—Buy signal effective 10/22/2014
International TTI: +1.69% (last close +1.74%)—Buy signal effective 2/13/2015
Disclosure: I am obliged to inform you that I, as well as advisory clients of mine, own some of these listed ETFs. Furthermore, they do not represent a specific investment recommendation for you, they merely show which ETFs from the universe I track are falling within the guidelines specified.
Contact Ulli