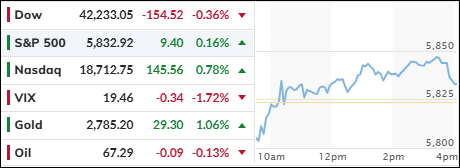
Gold Shines As Stocks Sink On Interest Rate Fears And Chip Woes

Ulli Market Commentary Contact

[Chart courtesy of MarketWatch.com]

  1. Moving the markets

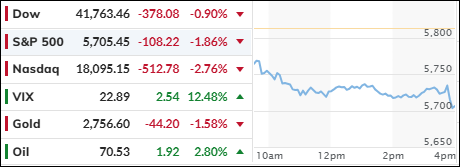
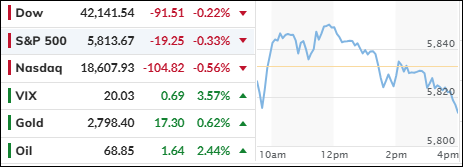
The stock market had a rough day on Wednesday, after the S&P 500 got too close to its glass ceiling and bounced back down.

It was a busy day for earnings reports and rising interest rates, which made investors nervous and jittery. The 10-year bond yield jumped over 4.9%, the highest since 2007. That’s bad news for anyone who wants to buy a house, because the average 30-year mortgage rate just hit 8%, the highest since 2000. Ouch!

Earnings were a mixed bag, with only 10% of the S&P 500 companies reporting so far, according to FactSet. Most of them beat the low expectations, but that’s not saying much. The real question is what they expect for the future, and how the interest rates will affect their business.

Chip stocks like Nvidia and AMD had another bad day, as the U.S. government decided to limit their sales of AI chips to China. That’s a big blow to their growth prospects, and traders were quick to dump their shares.

The war between Israel and Hamas also weighed on the market, as investors flocked to gold as a safe haven. Gold prices soared again, along with energy and oil stocks. They were the only ones having a good time on Wednesday.

Banks were among the worst performers, especially Morgan Stanley, which dropped more than 6%. That was its worst day since June 2020. The short squeeze craze also fizzled out, as small-cap stocks took a nosedive.

With the AI sector in trouble, could we see a repeat of the Covid/Crypto boom and bust? Or is this just a temporary setback for the tech giants?

Read More

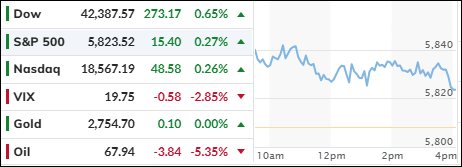
Markets Ride The Roller Coaster Of Rising Yields And Earnings

Ulli Market Commentary Contact

[Chart courtesy of MarketWatch.com]

  1. Moving the markets

The markets were like a roller coaster on Tuesday, as investors felt the heat from rising bond yields.

But they also got some relief from the third-quarter earnings season that kicked off with a bang. The 10-year U.S. Treasury yield soared to 4.84%, the highest since Oct. 6 — when it was a hair away from 4.9%. The reason? Retail sales data that came in hotter than a jalapeño, after plunging 5.4% in September.

Higher yields have been a thorn in the side of the market for weeks, as traders worry about the Fed tightening the screws for longer than expected. They also wonder how the Israel-Hamas war will affect the global economy.

It’s all about the bond market these days, as usual. The trend of higher yields, that started in July, is back with a vengeance after a brief pause. But there’s a silver lining: the 3rd quarter earnings season has been off to a good start, easing some of the traders’ fears. The question is: can that last, or will higher yields spoil the party?

Homebuilder Sentiment took another dive, hitting a 9-month low, while US Manufacturing Production shrank YoY for the 7th month in a row. The Service sector also tanked in October, reaching its lowest level since January.

These headlines confirm what traders already think: the economy is going downhill, and the Fed needs to cut rates to save the day. But what if they don’t?

Financial conditions have gotten worse, with rate hike expectations rising, which is bad news for stocks. But traders seem oblivious to that, even though they saw another bond sell-off due to soaring yields.

Just look at this: the 2-year yield hit 5.23% today, which is crazy considering the 2006 high was 5.275%. The last time it was higher than that was in December 2000, according to ZeroHedge.

The same thing happened with the 5-year yield, which reached 4.88%, the highest since July 2007. Ouch! No wonder mortgage rates are creeping up to the 8% mark, the highest in more than 23 years.

But thanks to another short squeeze, the S&P 500 managed to touch its resistance level, which matched its 50-day M/A. NVDA got hammered, the dollar ended flat, while gold moved sideways but closed slightly higher.

This makes me curious: how long can this gap between higher yields and rising stocks last? This chart has the answer, but we don’t know yet if it will be a snap down or a snap up.

Read More

Earnings Boost Stocks, Bond Yields And Middle East Woes Weigh

Ulli Market Commentary Contact

[Chart courtesy of MarketWatch.com]

  1. Moving the markets

Traders had a lot on their plate on Monday: a flood of corporate earnings reports, rising bond yields, and simmering tensions in the Middle East. But they chose to focus on the positive and pushed stocks higher.

The S&P 500 rose by about 1%, but it still faces a hurdle: the top of its downward trend channel that started in July. Could it break through this barrier and end the bear market rally? It needs another 0.75% boost to find out.

This week, 11% of the S&P 500 companies will report their earnings. Some big names include Johnson & Johnson, Bank of America, Netflix, and Tesla. Will they beat expectations or disappoint the market?

Wall Street traders are not relaxing yet. They know that volatility could spike by the end of the year, as bond yields and oil prices climb, inflation stays high, and conflict brews in the Middle East.

But they are also hopeful that earnings and the Fed will save the day. Powell will talk about interest rates and policy outlook on Thursday at the Economic Club in New York. Will he be dovish or hawkish? Will he taper its bond-buying program or keep it steady?

As for our Domestic Trend Tracking Index (TTI-section 3), it is still in bearish territory, meaning that the overall market trend is down. We are waiting for a signal to change our portfolio allocation.

In the meantime, trading in equities may be rangebound. The Middle East conflict is like a chess game that could turn violent at any moment. But earnings are like a ray of sunshine that could brighten up the market.

For now, traders are ignoring the dark clouds and enjoying the sunny day. They are driving equities higher, even as bond yields rise. As ZeroHedge showed in this chart, we have seen this movie before, and it did not have a happy ending.

The short squeeze strategy finally worked today, after failing for three days. The dollar fell, crude oil slid, and gold paused after soaring last week.

This week, we will also get some economic data on retail sales and housing. And we will hear from several Fed speakers, including Powell. Will they sing in harmony or discord?

Read More

ETFs On The Cutline – Updated Through 10/13/2023

Ulli ETFs on the Cutline Contact

Do you want to know which ETFs are hot and which ones are not? Then you need my High-Volume ETF Cutline report. It tells you how close or far each of the 311 ETFs I follow is from its long-term trend line (39-week SMA). These are the ETFs that trade more than $5 million a day, so they are not some obscure funds that nobody cares about.

The report is split into two parts: The winners that are above their trend line (%M/A), and the losers that are below it. The yellow line is the line of shame that separates them. You can see how many ETFs are in each group and how they have changed since the last report (63 vs. 69 current).

Take a peek:

The HV ETF Master Cutline Report

If you are confused by some of the terms we use, don’t panic. I have a helpful Glossary of Terms for you.

If you want to learn more about the Cutline method and how it can make you rich (or at least less poor), read my original post here.

ETF Tracker Newsletter For October 13, 2023

Ulli ETF Tracker Contact

ETF Tracker StatSheet          

You can view the latest version here.

STOCKS FALL ON FRIDAY AS INFLATION FEARS SPOOK INVESTORS: IS THE FED STUCK BETWEEN A ROCK AND A HARD PLACE?

[Chart courtesy of MarketWatch.com]

  1. Moving the markets

The markets had a roller coaster ride on Friday, as oil prices soared, and inflation fears spooked investors. Wall Street closed a turbulent week with losses across the board, but the major indexes eked out a gain.

Big banks like JPMorgan Chase and Wells Fargo reported strong earnings for the third quarter, thanks to a generous bailout from Uncle Sam earlier this year (1st Republic Bank). But that didn’t impress the market much, and stocks only got a brief lift from lower Treasury yields.

The 10-year yield dropped to 4.598%, while the 2-year yield dipped to 5.02%. The Fed tried to calm the nerves of traders, as Philly Fed President Patrick Harker said he sees no need to hike rates anytime soon.

But the market wasn’t buying it, as consumer sentiment plunged in October and inflation expectations surged to the highest level since May. The one-year inflation outlook jumped from 3.2% to 3.8%, dragging down the US Macro data index.

The S&P 500 hit rock bottom midday, as oil prices spiked over 6% amid fears of a wider conflict in the Middle East.

The Israel-Hamas war rattled the oil market, sending WTI crude up more than 4% for the week, its best performance since Sept. 1. Gold also shined, jumping over 3% on Friday and over 5% for the week, its biggest weekly gain since March.

Investors flocked to “war hedges” like gold and oil, as bond yields slipped but remained above 5%.

The Nasdaq was flat for the week, while the S&P and Dow eked out small gains despite some nasty swings. Small Caps got hammered, losing over 3% for the week, their worst performance since March.

Airlines also took a beating, as higher oil prices hurt their bottom line. The Regional Bank Index (KRE) fell, even though bank earnings were solid. The most shorted stocks continued their downward spiral, falling for the ninth time in eleven weeks. The dollar had a wild ride, ending slightly higher for the week.

It was a crazy week on Wall Street, but nothing seems to shake the Fed’s resolve to keep printing money like there’s no tomorrow. But how long can they keep this up?

They have two choices: either raise rates and kill inflation along with the economy and the markets or keep printing money and kill the dollar in your pocket.

Which poison will they pick?

Read More

Weekly StatSheet For The ETF Tracker Newsletter – Updated Through 10/12/2023

Ulli ETF StatSheet Contact

ETF Data updated through Thursday, October 12, 2023

How to use this StatSheet:

  1. Out of the 1,800+ ETFs out there, I only pick the ones that trade over $5 million per day (HV ETFs), so you don’t get stuck with a lemon that nobody wants to buy or sell.
  1. Trend Tracking Indexes (TTIs)

These are the main indicators that tell you when to buy or sell Domestic and International ETFs (section 1 and 2). They do that by comparing their position to their long-term M/A (Moving Average). If they cross above, and stay there, it’s a green light to buy. If they fall below, and keep going, it’s a red light to sell. And to make sure you don’t lose your shirt if things go south, I also use a 12% trailing stop loss on all positions in these categories.

  1. All other investment areas don’t have a TTI and should be traded based on the position of each ETF relative to its own trend line (%M/A). That’s why I call them “Selective Buy.” In other words, if an ETF goes above its own trend line, you can buy it. But don’t forget to use a trailing sell stop of 12%, or less if you’re feeling nervous.

If some of these words sound like Greek to you, please check out the Glossary of Terms and new subscriber information in section 9.

  1. DOMESTIC EQUITY ETFs: SELL— since 09/22/2023

Click on chart to enlarge

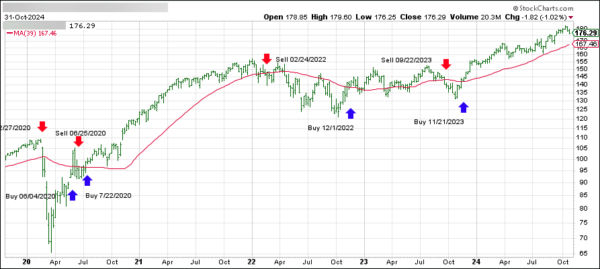
This is our main compass, the Domestic Trend Tracking Index (TTI-green line in the above chart). It has now broken below its long-term trend line (red) by -3.30% and has moved into “Sell” mode effectively 9/22/2023.

Read More