
- Moving the markets
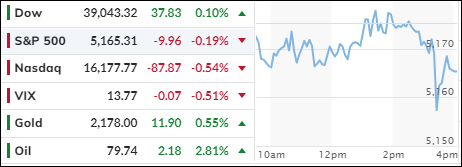
The S&P 500 took a breather Wednesday, retreating from its recent peak, as Nvidia’s sizzling start to 2024 finally saw a chill. The trading floor was still buzzing from Tuesday’s gains, where the S&P 500 and Nasdaq jumped over 1% after inflation reports aligned with the crystal ball predictions. Core inflation, minus the munchies and gas, ticked up a notch last month but didn’t dampen the spirits of the ever-optimistic market mavens.
As we inch closer to the Fed’s pow-wow on March 19, traders are on the edge of their seats, anticipating Fed Chair Jerome Powell’s next move. Will he stick to the script of being data-driven and keep a steady hand on the wheel?
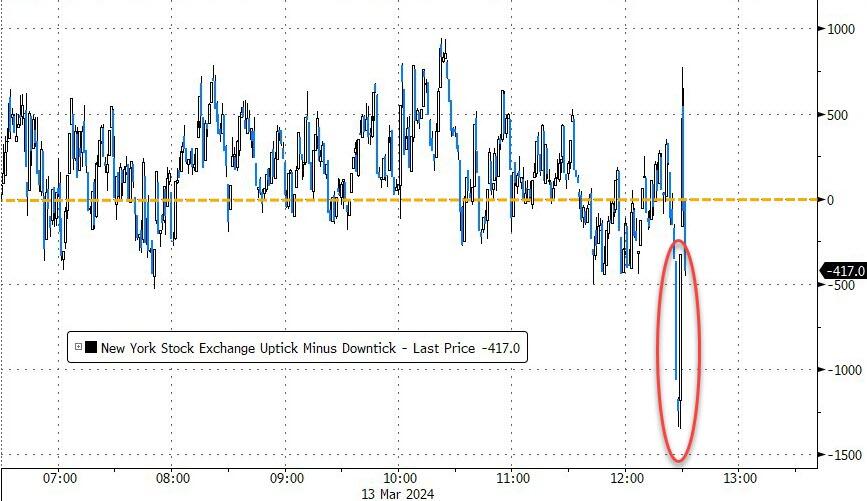
In the meantime, it’s been a seesaw session: Small Caps took the lead, while Nasdaq played catch-up… that is until a last-minute sell-off shook things up. The Dow and Small Caps scraped together some modest wins, but Nasdaq and S&P weren’t so lucky, ending up in the red.
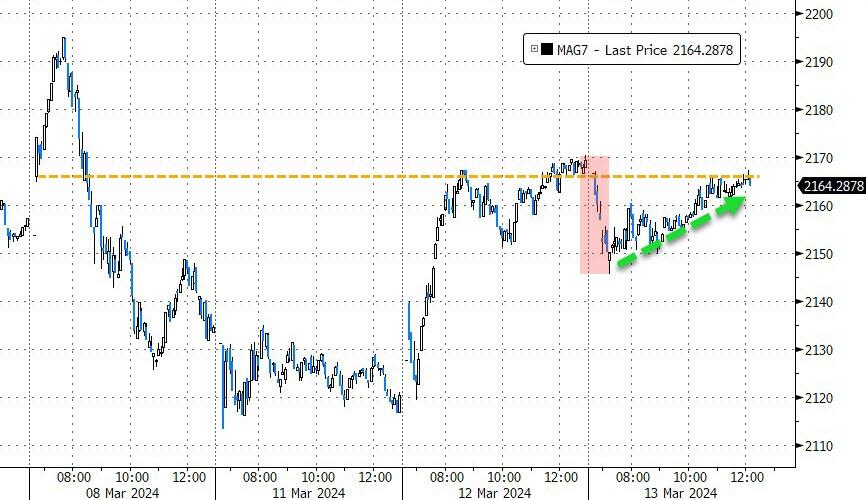
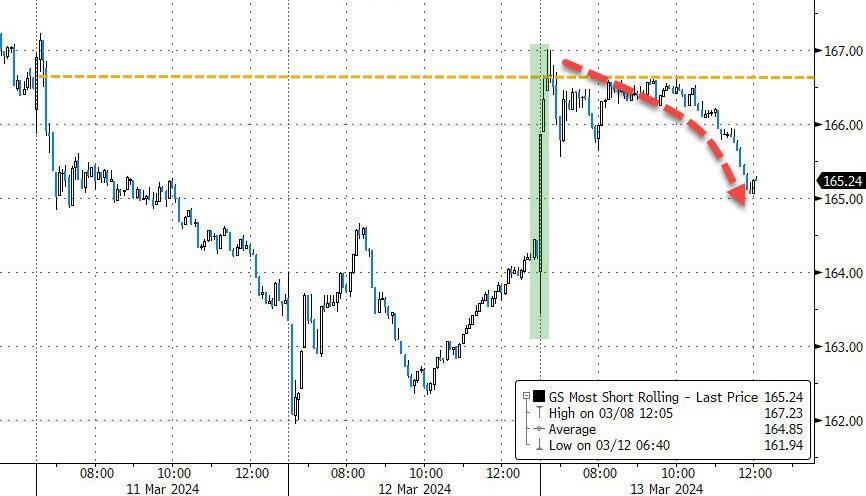
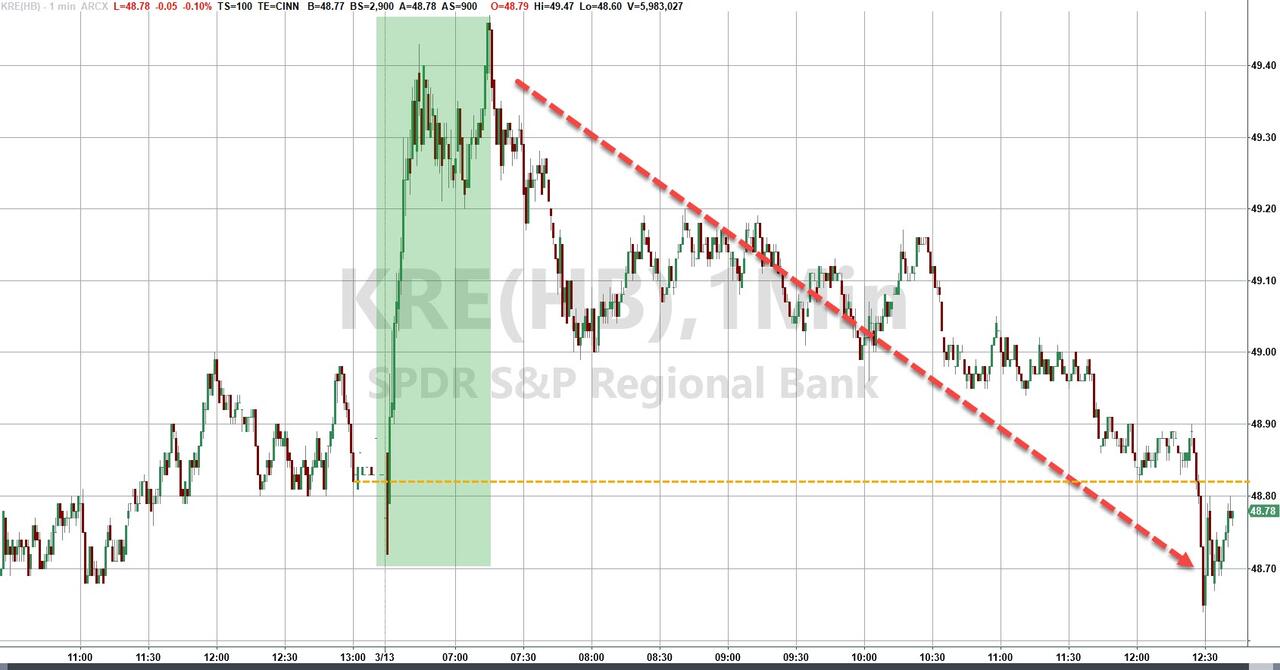
The “Magnificent 7” had a less than magnificent day, struggling to shine despite a brief comeback. Meanwhile, the most shorted stocks got a morning boost only to lose steam, mirroring bank stocks that started strong but closed weaker as the Fed’s safety net program (BTFP) wrapped up.
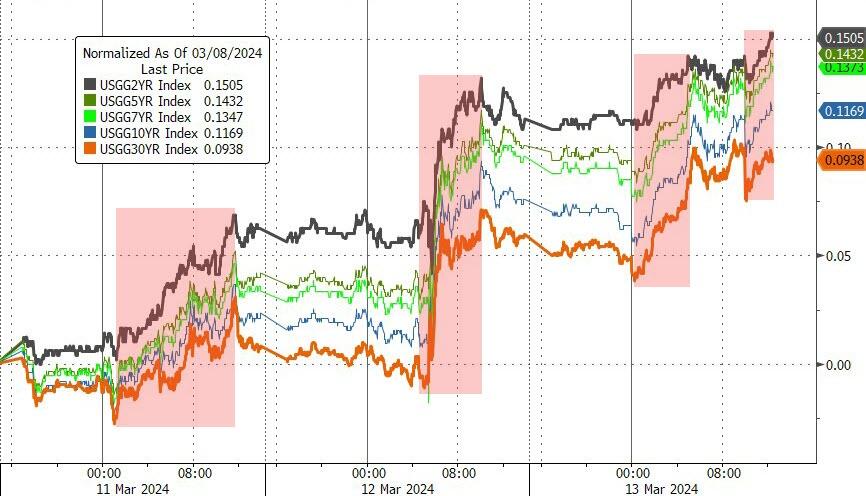
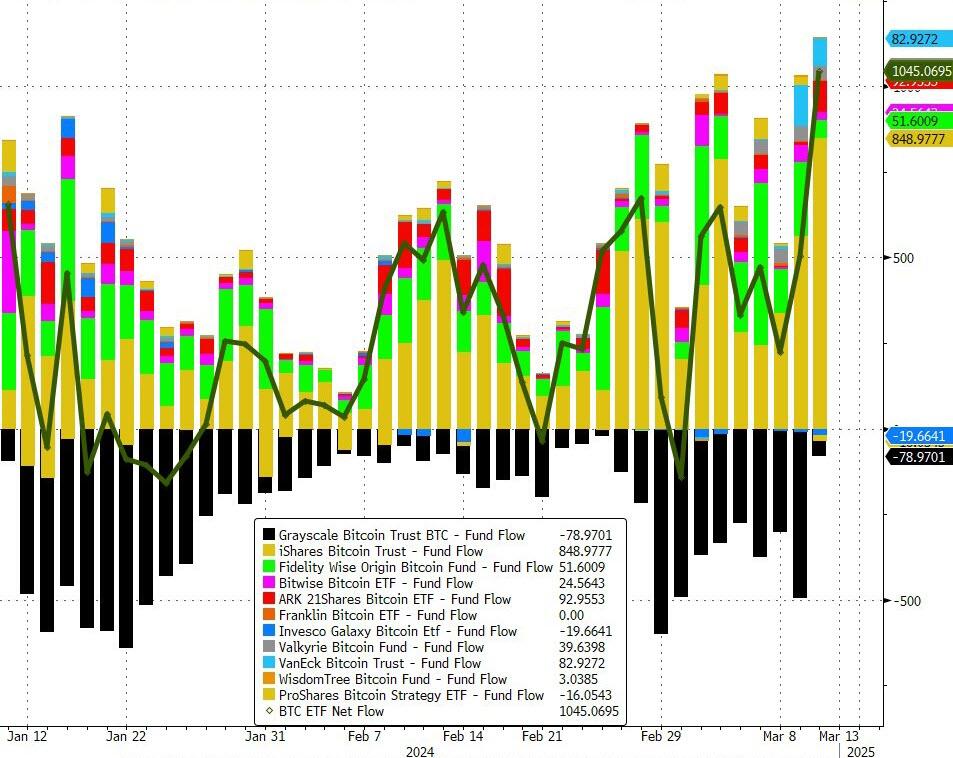
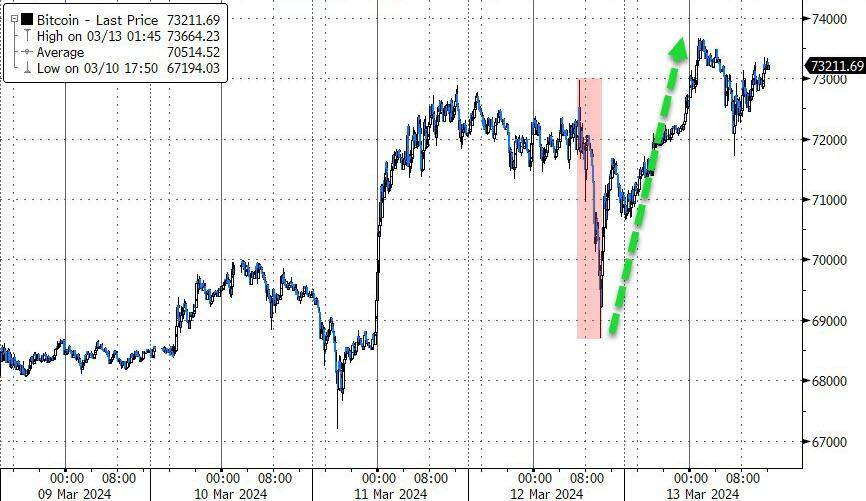
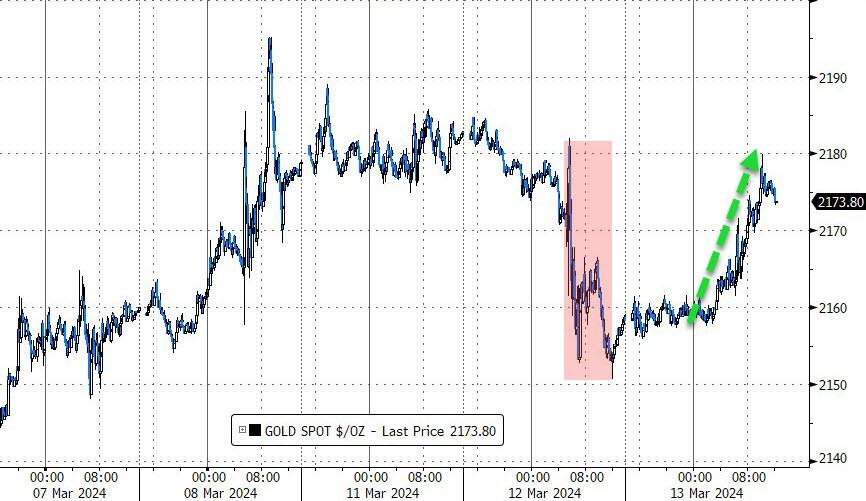
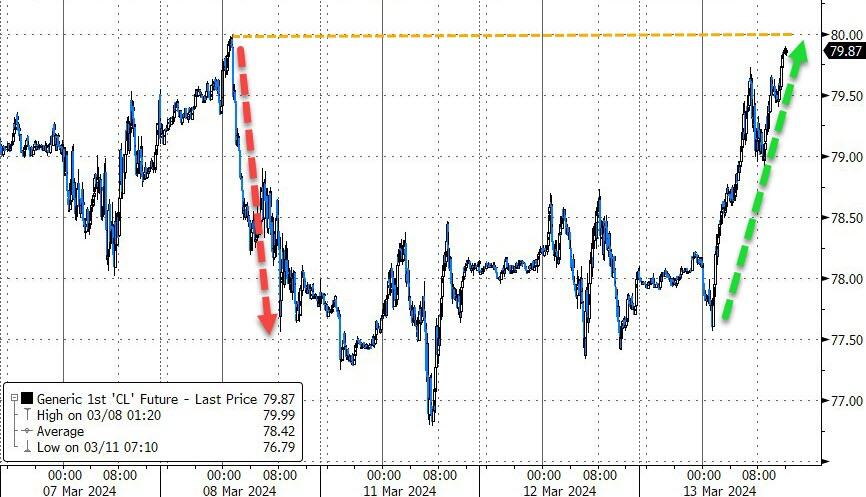
On the bond front, yields were up, but the real headline-grabber was Bitcoin’s ETFs, which saw a record-breaking influx of over $1 billion, catapulting Bitcoin to a dizzying $73,000 high. Not to be outdone, Gold wiped away its losses, and oil prices soared, adding to the market’s rollercoaster ride.
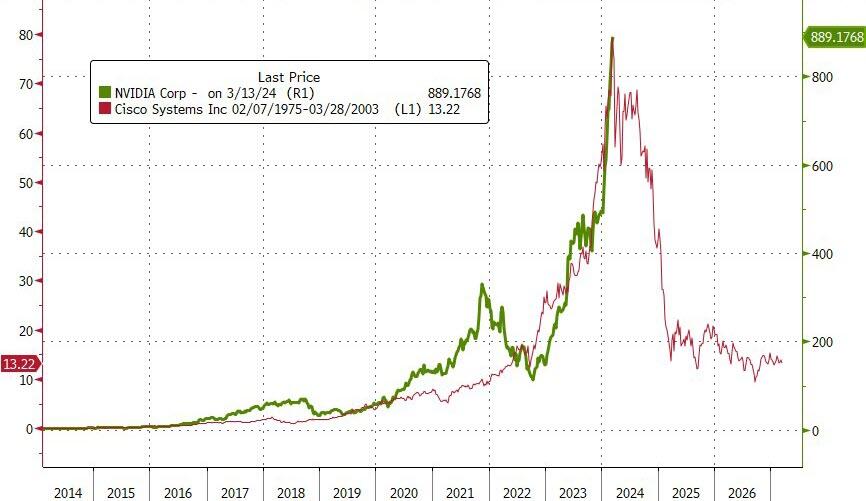
So, as we ponder the parallels between Cisco Systems and Nvidia, one must wonder: are we on the cusp of déjà vu all over again?
2. Current “Buy” Cycles (effective 11/21/2023)
Our Trend Tracking Indexes (TTIs) have both crossed their trend lines with enough strength to trigger new “Buy” signals. That means, Tuesday, 11/21/2023, was the official date for these signals.
If you want to follow our strategy, you should first decide how much you want to invest based on your risk tolerance (percentage of allocation). Then, you should check my Thursday StatSheet and Saturday’s “ETFs on the Cutline” report for suitable ETFs to buy.
3. Trend Tracking Indexes (TTIs)
Today’s market activity was characterized by a lack of clear direction, resulting in a flat trend where two out of the three major indexes closed with losses.
Our TTIs experienced minimal changes and continued to indicate a positive trend.
This is how we closed 3/13/2024:
Domestic TTI: +10.84% above its M/A (prior close +10.82%)—Buy signal effective 11/21/2023.
International TTI: +10.23% above its M/A (prior close +10.00%)—Buy signal effective 11/21/2023.
All linked charts above are courtesy of Bloomberg via ZeroHedge.
———————————————————-
WOULD YOU LIKE TO HAVE YOUR INVESTMENTS PROFESSIONALLY MANAGED?
Do you have the time to follow our investment plans yourself? If you are a busy professional who would like to have his portfolio managed using our methodology, please contact me directly to get more details.
—————————————————————-
Contact Ulli