
- Moving the markets
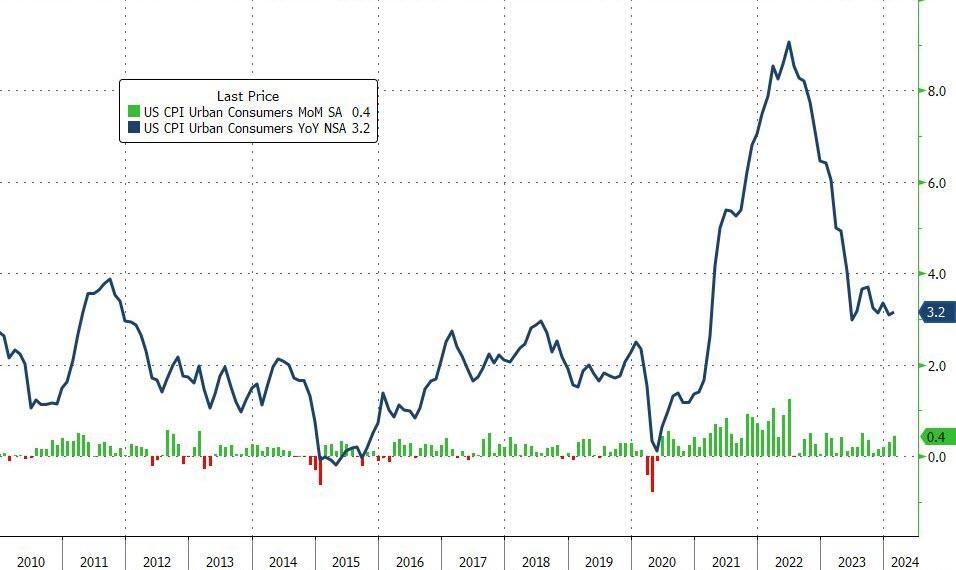
On a day when the inflation report played nice and mostly met the expectations for February, the stock market decided to throw a little party of its own. The consumer price index, which is like the economy’s thermometer, rose by 0.4% last month, hitting a 3.2% year-over-year fever. The economists’ crystal balls predicted this well, except they were off by a smidge, expecting a 3.1% annual increase.
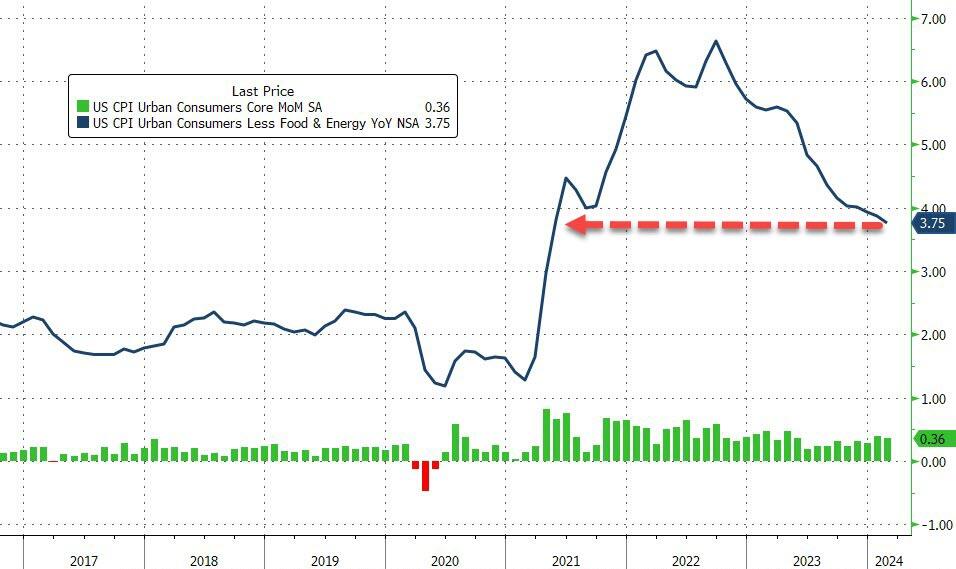
Now, let’s talk about core inflation – that’s inflation without the mood swings of food and energy prices. It got a bit spicy, rising 0.4% in February, which is a tad hotter than the forecasted 0.3%. Year-over-year, it’s up by 3.8%, outpacing the 3.7% forecast. But hey, it’s still the coolest it’s been since April two years ago.
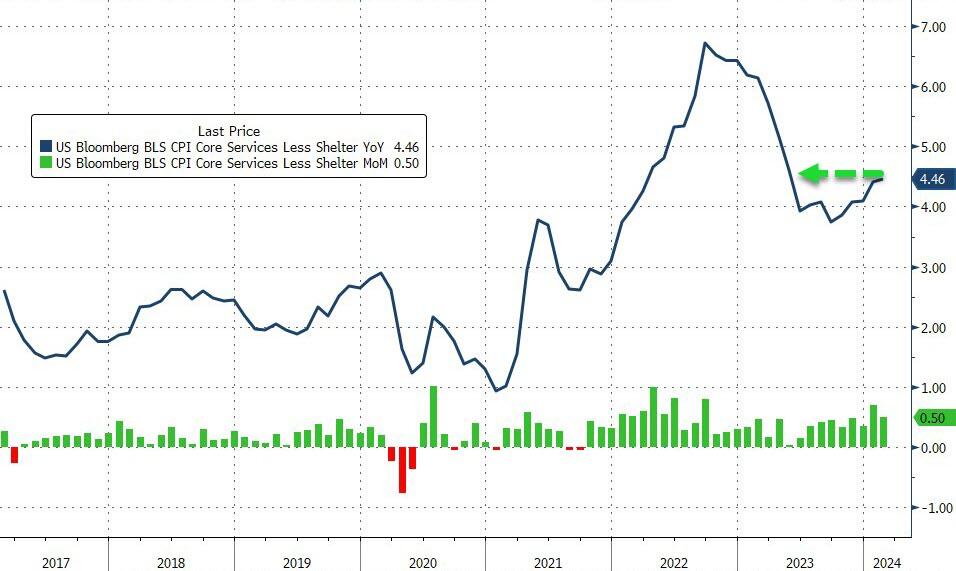
Diving deeper into the numbers, we find the ‘Super Core’ – think of it as the core of the core, minus housing costs. It jumped 0.5% month-over-month, reaching a scorching 4.5% year-over-year – the highest since the days of May 2023.
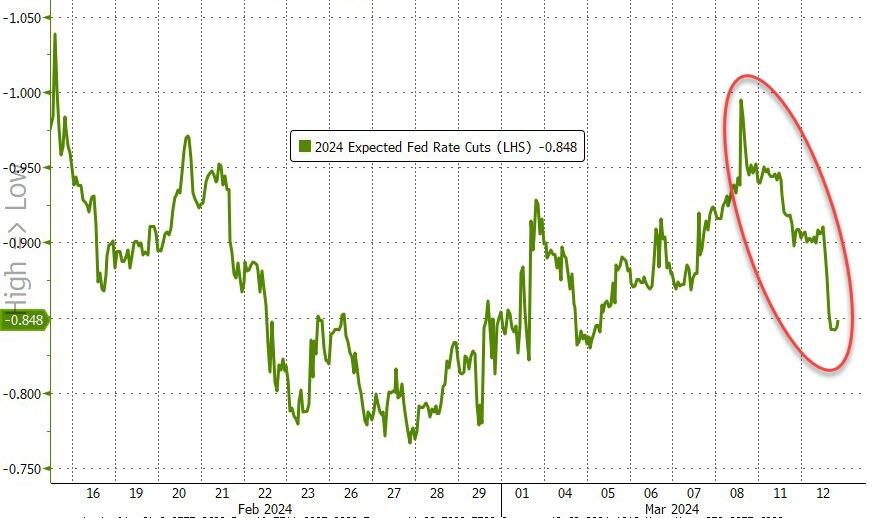
Some Wall Street folks are sweating over these numbers, thinking they might throw a wrench in the Federal Reserve’s plans to start slicing interest rates come June. The road to their 2% inflation target is looking a bit more like a game of “Where’s Waldo?”
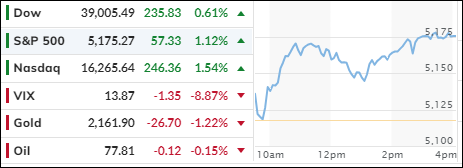
In the tech world, stocks were on a caffeine buzz. Nvidia’s shares leaped 3%, Microsoft edged up about 2%, and Oracle? Well, they blasted past 10% after showing Wall Street they’ve got the earnings muscle.
As traders shift their gaze to the upcoming producer price index (PPI) and the Fed’s monetary policy huddle later this month, the financial playground is getting interesting.
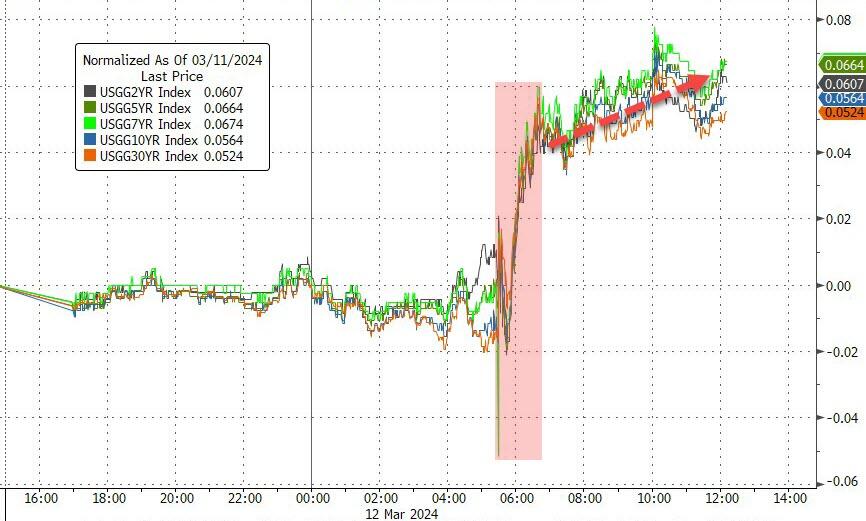
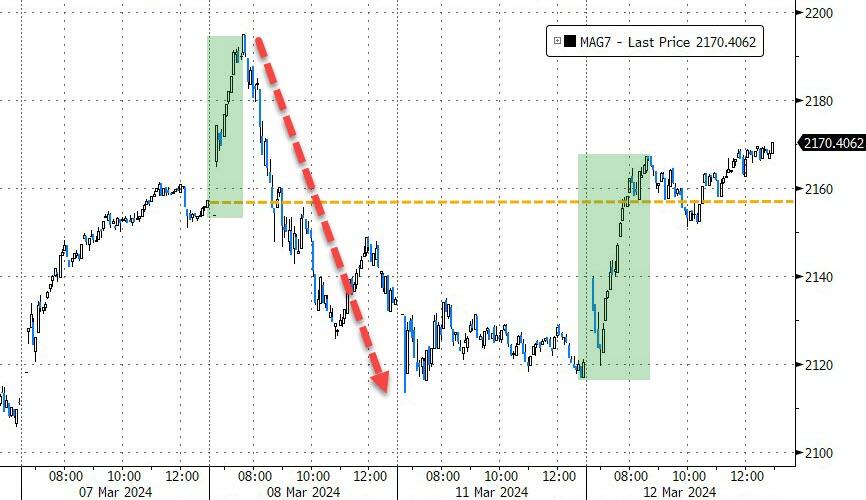
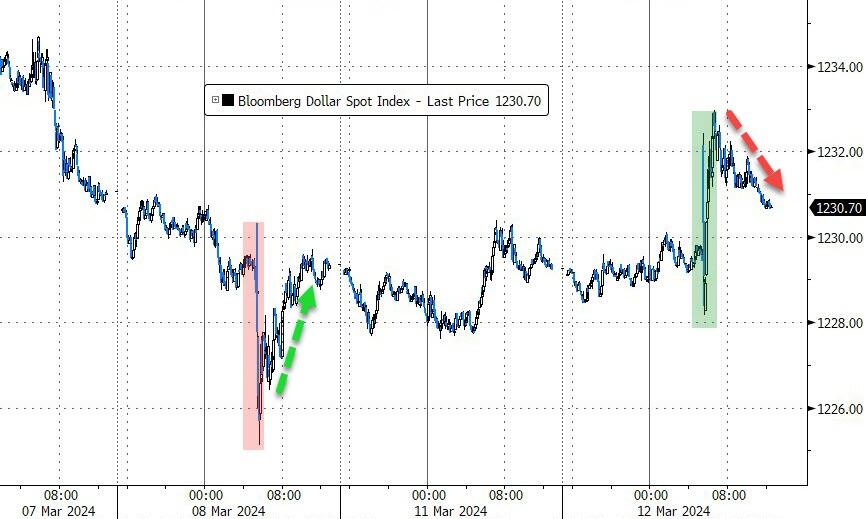
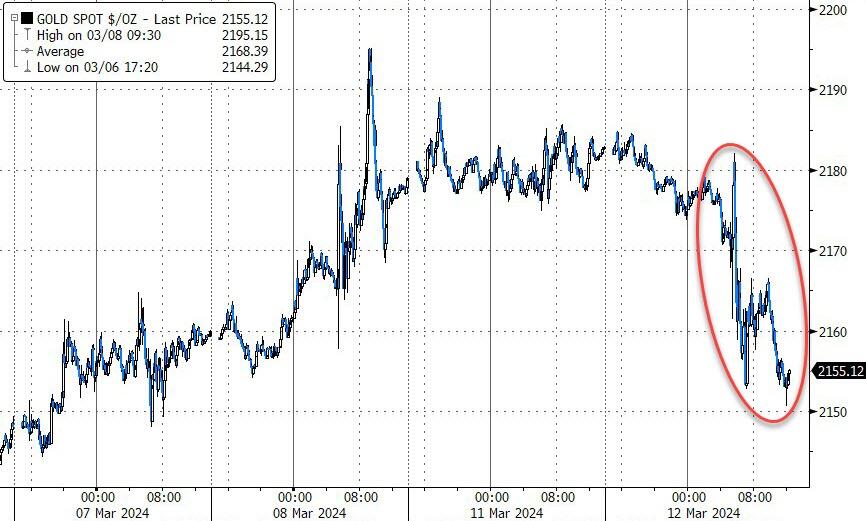
Bond yields climbed the jungle gym, the MAG7 stocks bounced back like they’re on a trampoline, the dollar did a hopscotch routine, and gold took a breather after sprinting to record highs.
With a few more economic breadcrumbs left this week, the market could flip faster than a pancake at a breakfast buffet.
So, the question remains – will the market end the week flexing for the bulls or playing dead for the bears?
2. Current “Buy” Cycles (effective 11/21/2023)
Our Trend Tracking Indexes (TTIs) have both crossed their trend lines with enough strength to trigger new “Buy” signals. That means, Tuesday, 11/21/2023, was the official date for these signals.
If you want to follow our strategy, you should first decide how much you want to invest based on your risk tolerance (percentage of allocation). Then, you should check my Thursday StatSheet and Saturday’s “ETFs on the Cutline” report for suitable ETFs to buy.
3. Trend Tracking Indexes (TTIs)
The market soared today, buoyed by the anticipated Consumer Price Index (CPI) reading. Despite the core CPI exceeding expectations, traders remained upbeat and drove the indexes higher.
Our TTIs also participated in the positive sentiment, making moderate gains.
This is how we closed 3/12/2024:
Domestic TTI: +10.82% above its M/A (prior close +10.55%)—Buy signal effective 11/21/2023.
International TTI: +10.00% above its M/A (prior close +9.47%)—Buy signal effective 11/21/2023.
All linked charts above are courtesy of Bloomberg via ZeroHedge.
———————————————————-
WOULD YOU LIKE TO HAVE YOUR INVESTMENTS PROFESSIONALLY MANAGED?
Do you have the time to follow our investment plans yourself? If you are a busy professional who would like to have his portfolio managed using our methodology, please contact me directly to get more details.
—————————————————————-
Contact Ulli