Weekly StatSheet For The ETF/No Load Fund Tracker Newsletter – Updated Through 08/13/2015

Ulli ETF StatSheet Contact

ETF/Mutual Fund Data updated through Thursday, August 13, 2015

TOC021915

If you are not familiar with some of the terminology used, please see the Glossary of Terms.


1. DOMESTIC EQUITY MUTUAL FUNDS/ETFs: BUY — since 10/22/2014

TTI

Our main directional indicator, the Domestic Trend Tracking Index (TTI), broke through its long-term trend line generating a “Sell” for this arena effective 10/14/2014, which was followed by a violent break back above the line on 10/22/14 generating a new “Buy.” It was a classic whipsaw signal, and you can read more on my blog as to the events as they were unfolding.

As of today, our TTI (green line in above chart) is positioned above its long term trend line (red) by +0.54% keeping us in the market with our established positions.

Read More

Indexes Mixed As Volatility Remains High

Ulli Market Commentary Contact

Thur pic

[Chart courtesy of MarketWatch.com]

1. Moving the Markets

It was another choppy day with the S&P slipping right out of the gates, finding some traction and rallying above the unchanged line but giving back its gains into the close.

The energy sector got spanked again while consumer discretionaries were the bright star today. We’re still stuck as Wall Street finds itself between a rock and hard place trying to shake off China’s devaluation move this week and wondering if the economy is really healthy enough to warrant a rise in interest rates by the Fed.

With no new data scheduled for tomorrow, we may continue to struggle in finding a clear direction.

In the end, it was another mixed day with 3 of our 10 ETFs in the Spotlight gaining and 7 of them retreating. Heading the gainers was Consumer Discretionaries (XLY) with +0.58%, while on the loser’s side Consumer Staples (XLP) fared the worst with -0.40%.

Read More

Stocks Stay Above Board After China Currency Shift

Ulli Market Commentary Contact

Wed pic

[Chart courtesy of MarketWatch.com]

1. Moving the Markets

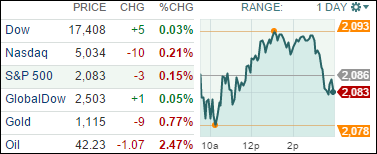
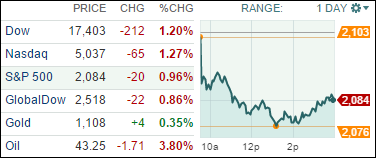
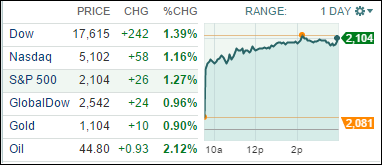
U.S. stocks had a “9th inning rally” today, as they were able to overcome substantial early day losses and close higher across the board. Investors were anxious as the day began, given the recent devaluation of the RMB and the rising concerns about the health of China’s wobbly economy. Given China’s clout in the world economy, any signs of a more severe slowdown there is viewed bearishly, as slower growth equates to less sales, smaller corporate profits and, subsequently, lower stock prices.

Utilities and Energy lead the sector gains today, with each posting 1.32% and 1.38 % respectively.

Adding to China tech investor concerns, Alibaba Group Holding Ltd’s (BABA) shares fell to a record low after the company posted its slowest revenue growth in over three years, as its strategy to shift more services to mobile devices hurt advertising sales. The company’s results come at a time when China’s economy is expected to grow at its slowest pace in a quarter of a century.

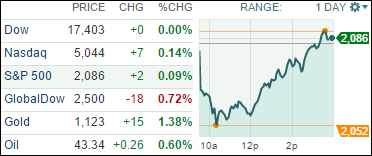
Heading towards the end of the week, investors will be on edge as to how domestic markets will react to the currency downgrade in China, as well as how the EU is going to move forward after the latest decision in Greece.

Our 10 ETFs in the Spotlight were mixed during this roller-coaster day with 6 of them gaining and 4 of them closing down. The leader of the pack was Select Dividends (DVY) with +0.56% while the loser of the day turned out to be the Financials (IYF) with -0.70%.

Read More

China Devalues; Global Markets In Retreat Mode

Ulli Market Commentary Contact

Tue pic

[Chart courtesy of MarketWatch.com]

1. Moving the Markets

For the time being, today’s pullback makes yesterday’s big advance look like a dead cat bounce. Just as the bulls had taken charge, the rug was pulled out from under them as the Chinese devalued the Yuan sending world markets reeling.

This brought up concerns as to whether the slowdown in China is worse than had been expected. The immediate negative effect was on automakers, commodity producers and other exporters; even Apple dropped 5.2%.

The devaluation was 1.9%, which was the most in a couple of decades. Some of the recent economic numbers out of China showed plunging exports and overall weakness in manufacturing. The big question is: will this now lead to a new round of currency devaluation by others as well and the beginning of trade wars? Only time will tell; but it appears to me that the current market volatility may be with us for a while longer.

In a reversal from yesterday, all of our 10 ETFs in the Spotlight changed direction and headed south as bulls were absent all day. Taking the lead to the downside was the Global 100 (IOO) with -1.19%, while Consumer Staples (XLP) and the Low Volatility S&P (SPLV) held up best by dropping only 0.36% each.

Read More

Dow Breaks Seven Day Losing Streak; Buffet Deal Tops Headlines

Ulli Market Commentary Contact

Mon pic

[Chart courtesy of MarketWatch.com]

1. Moving the Markets

We have all been wondering when the Dow was going to move back into positive territory after a seven day losing streak. Well, today investors had their rally caps on apparently. The Dow jumped 242 points It was the biggest gain for the blue-chip index since May 8. The Dow recouped a large amount of its 378 point loss that it racked up over 7 days in its longest run of losses in four years.

As for the S&P, nine of the ten sectors closed higher. The energy sector took the lead with a 3.1% gain as oil prices rebounded. Benchmark U.S. crude jumped 2% to $44.74 a barrel after falling below $44 on Friday. The energy sector has slumped 16% in the last three months as oil has dropped back toward its low of the year. Utilities were the sole sector in the red.

In the M&A space, Mr. Buffet stole headlines today as news announced he will be closing on the largest deal in Berkshire Hathaway history. Berkshire (BRK.A, BRK.B) said today that it will pay $235 per share in cash for all of Portland based Precision Castparts’ (PCP) shares. That represents a 21% premium on the stock’s Friday closing price of $193.88. The global manufacturer makes castings, forged components, aerostructures and fasteners for the aerospace market. It also produces pipe and fittings for the power business and many other parts. The companies expect the deal to close in the first quarter of 2016.

All of our 10 ETFs in the Spotlight enjoyed today’s rebound and closed up. The leader was Mid-Cap Value (IWS) with +1.54%, while the laggard turned out to be Consumer Staples (XLP) with +0.38%.

Read More

ETFs/Mutual Funds On The Cutline – Updated Through 08/07/2015

Ulli ETFs on the Cutline Contact

Below are the latest ETF Cutline reports, which show how far above or below their respective long-term trend lines (39 week SMA) my currently tracked ETFs/MFs are positioned.

The first report covers the ETF Master List from Thursday’s StatSheet and includes 410 ETFs, of which currently 143 (last week 178) are hovering in bullish territory.

The second report includes only High Volume ETFs. To clarify, High Volume (HV) ETFs are defined as those with an average daily volume of $10 million or higher.

These ETFs are generated from my selected list of some 97 that I use in my advisor practice. It cuts out the “noise,” which simply means it eliminates those ETFs that I would never buy because of their volume limitations. 24 ETFs (last week 33) have managed to remain in bullish territory after the recent market volatility.

The third report covers Mutual Funds on the Cutline. There are currently 314 (last week 430) above the line and 506 below it out of the 820 that I follow.

Take a look:

  1. ETF Master Cutline Report
  2. ETF High Volume Cutline Report
  3. MF Cutline Report

In case you are not familiar with some of the terminology used in the reports, please read the Glossary of Terms.

If you missed the original post about the Cutline approach, you can read it here.