
1. Moving the Markets
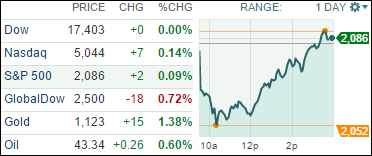
U.S. stocks had a “9th inning rally” today, as they were able to overcome substantial early day losses and close higher across the board. Investors were anxious as the day began, given the recent devaluation of the RMB and the rising concerns about the health of China’s wobbly economy. Given China’s clout in the world economy, any signs of a more severe slowdown there is viewed bearishly, as slower growth equates to less sales, smaller corporate profits and, subsequently, lower stock prices.
Utilities and Energy lead the sector gains today, with each posting 1.32% and 1.38 % respectively.
Adding to China tech investor concerns, Alibaba Group Holding Ltd’s (BABA) shares fell to a record low after the company posted its slowest revenue growth in over three years, as its strategy to shift more services to mobile devices hurt advertising sales. The company’s results come at a time when China’s economy is expected to grow at its slowest pace in a quarter of a century.
Heading towards the end of the week, investors will be on edge as to how domestic markets will react to the currency downgrade in China, as well as how the EU is going to move forward after the latest decision in Greece.
Our 10 ETFs in the Spotlight were mixed during this roller-coaster day with 6 of them gaining and 4 of them closing down. The leader of the pack was Select Dividends (DVY) with +0.56% while the loser of the day turned out to be the Financials (IYF) with -0.70%.
2. ETFs in the Spotlight
In case you missed the announcement and description of this section, you can read it here again.
It features 10 broadly diversified ETFs from my HighVolume list as posted every Monday. Furthermore, they are screened for the lowest MaxDD% number meaning they have been showing better resistance to temporary sell offs than all others over the past year.
Here are the 10 candidates:
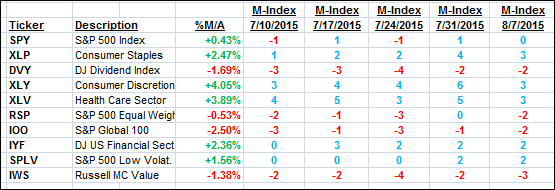
The above table simply demonstrates the magnitude with which some of the ETFs are fluctuating in regards to their positions above or below their respective individual trend lines (%M/A). A break below, represented by a negative number, shows weakness, while a break above, represented by a positive percentage, shows strength.
For hundreds of ETF/Mutual fund choices, be sure to reference Thursday’s StatSheet.
Year to date, here’s how the above candidates have fared so far:
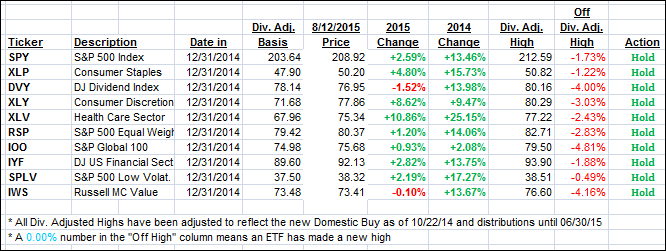
Again, the first table above shows the position of the various ETFs in relation to their respective long term trend lines (%M/A), while the second one tracks their trailing sell stops in the “Off High” column. The “Action” column will signal a “Sell” once the -7.5% point has been taken out in the “Off High” column.
3. Trend Tracking Indexes (TTIs)
Our Trend Tracking Indexes (TTIs) were mixed with the Domestic one holding up better than its International cousin, which is now in danger of slipping below its trend line:
Domestic TTI: +0.66% (last close +0.70%)—Buy signal effective 10/22/2014
International TTI: +0.16% (last Friday +0.45%)—Buy signal effective 2/13/2015
Disclosure: I am obliged to inform you that I, as well as advisory clients of mine, own some of these listed ETFs. Furthermore, they do not represent a specific investment recommendation for you, they merely show which ETFs from the universe I track are falling within the guidelines specified.
Contact Ulli