ETFs/Mutual Funds On The Cutline – Updated Through 01/08/2016

Ulli ETFs on the Cutline Contact

Below are the latest ETF Cutline reports, which show how far above or below their respective long-term trend lines (39 week SMA) my currently tracked ETFs/MFs are positioned.

The first report covers the ETF Master List from Thursday’s StatSheet and includes 381 ETFs, of which currently 18 (last week 56) are hovering in bullish territory.

The second report includes only High Volume ETFs. To clarify, High Volume (HV) ETFs are defined as those with an average daily volume of $10 million or higher. Volume figures can change in a hurry, so be sure to check first before investing.

These ETFs are generated from my selected list of 98 that I use in my advisor practice. It cuts out the “noise,” which simply means it eliminates those ETFs that I would never buy because of their volume limitations. 6 ETFs (last week 9) have managed to remain in bullish territory after the recent market volatility.

The third report covers Mutual Funds on the Cutline. There are currently 13 (last week 30) above the line and 768 below it out of the 781 that I follow.

Take a look:

  1. ETF Master Cutline Report
  2. ETF High Volume Cutline Report
  3. MF Cutline Report

In case you are not familiar with some of the terminology used in the reports, please read the Glossary of Terms.

If you missed the original post about the Cutline approach, you can read it here.

One Man’s Opinion: Are Financials The Cheapest Among Cyclical Stocks In The Market?

Ulli Market Review Contact

ManUS equities are expected to give single-digit returns this year though the initial days look a little bad, said Bob Doll of Nuveen Asset Management. The current market turmoil looks a lot like August last year with plenty of similarities.

China authorities did some things then, and they will do some things now (to calm the markets). Chinese policy makers have to be focused on the domestic economy, and they have to be equally focused on the markets because that’s (the turmoil) exported all over the world. In the meantime, US consumers are doing just fine along with job growth, wage-rate gains and much cleaner individual balance sheets. The US domestic economy may not be doing great, but it’s doing fine, he noted.

Asked if it’s difficult to be an US equity strategist now since oil price forecast and Chinese currency movement is of paramount importance, Bob answered in the affirmative. For the markets to come out of the funk, stabilization of oil prices and a cessation of the dollar’s up-move versus the Yuan would be required, which would be achieved eventually as it was done in August.

Read More

New ETFs On The Block: First Trust SSI Strategic Convertible Securities ETF (FCVT)

Ulli Convertible Securities Contact

InvestingWhile the debate among market participants rages about the frequency of rate increases in 2016, investors worried about capital protection may consider an industry first fixed-income product product since not all bonds would get hammered with the gradual normalization of interest rates.
Case in point: convertible bonds that could potentially offer higher total returns as they allow meaningful participation in both equity returns and current income along with a certain degree of principal protection.

For the uninitiated, convertible bonds are debt instruments that can be converted into certain amount of ordinary shares of the issuer’s equity at some point in time. Convertibles, a hybrid debt instrument with equity-like traits, tend to outperform stocks in rising rate environments and have historically outpaced bonds during periods of rising rates. The embedded option that allows the holder to convert debt into equity pares the interest rate sensitivity of the convertible securities.

Read More

ETF/No Load Fund Tracker Newsletter For January 8, 2016

Ulli ETF Tracker Contact

ETF/No Load Fund Tracker StatSheet

————————————————————-

THE LINK TO OUR CURRENT ETF/MUTUAL FUND STATSHEET IS:

https://theetfbully.com/2016/01/weekly-statsheet-for-the-etfno-load-fund-tracker-newsletter-updated-through-01072016/

————————————————————

Market Commentary

MARKETS MELT DOWN IN WORST EVER FIRST WEEK TO START THE YEAR

Fri pic 

[Chart courtesy of MarketWatch.com]

1. Moving the Markets

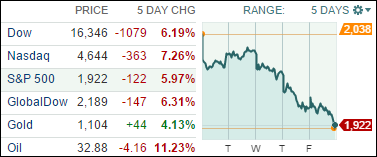
One look at the above chart shows the extent to which the bulls got slaughtered this week as the U.S. stock market saw an early rally fizzle out and finished sharply lower after a big late-day selloff. The selloff at the end of trading essentially dashed hopes for a market rebound today, despite a strong U.S. jobs report and a 2% rebound in China’s markets. Both the Dow and S&P 500 have posted their worst five-day start to a year in history.

Stocks got a big sentiment boost before the opening bell when the government reported that the U.S. economy created 292,000 jobs in December, which was well above the 200,000 estimate. But the early gains didn’t hold up as a look under the hood confirmed that most jobs were of the part-time variety. Job gains were also revised up 41,000 in November and 9,000 in October. The unemployment rate stayed steady at 5% in December for a third straight month.

All of our 10 ETFs in the Spotlight took a beating again, as they did all week, with the Financials (IYF) taking the dubious lead with -1.54% while the Dividend ETF (DVY) held up the best with a loss of -0.69%.

We remain on the sidelines as the bear market deepens. For the exact numbers, please see section 3 below.

Read More

Weekly StatSheet For The ETF/No Load Fund Tracker Newsletter – Updated Through 01/07/2016

Ulli ETF StatSheet Contact

ETF/Mutual Fund Data updated through Thursday, January 07, 2016

TOC010716

If you are not familiar with some of the terminology used, please see the Glossary of Terms.


1. DOMESTIC EQUITY MUTUAL FUNDS/ETFs: SELL — since 11/13/2015

TTI

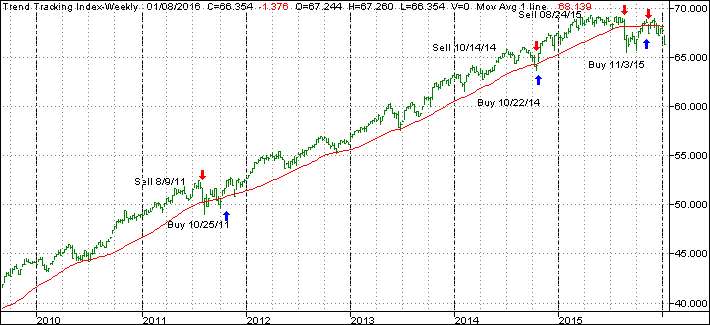
Our main directional indicator, the Domestic Trend Tracking Index (TTI-green line in above chart) has recently crawled above its long term trend line (red) and finally generated a new “Buy” signal effective 11/3/15. The market subsequently dropped, and we exited again on 11/13/15. As of today, the TTI remains below its trend line by -2.69%, which means we are in cash on the sidelines.

Read More

China Troubles Continue To Spank Wall Street

Ulli Market Commentary, Uncategorized Contact

Thur pic

[Chart courtesy of MarketWatch.com]

1. Moving the Markets

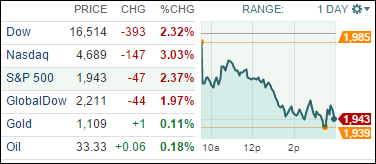
Wall Street’s worst opening to a new year since 2008 got even uglier today when repeated waves of selling sent the Dow tumbling almost 400 points and the Nasdaq into correction territory amid a global stock rout that started when China halted trading in its market again following a 7% plunge.

The real drama was in the tech-heavy Nasdaq Composite, which plunged 3% to 4689.43, leaving it more than 10% below its July record close and officially in correction territory.

China was again the epicenter of the sell-off. Sparking angst was a freefall in Chinese stocks at the start of trading there, which triggered a shutdown of the Chinese stock market about 30 minutes into the trading session. That marks the shortest trading day in the market’s short history. It was the second trading halt this week.

While Wall Street is in turmoil, it seems to me that for the first time in many years, equities appear to slowly move in sync with the actual performance of the economy and not be controlled and manipulated by the great enabler of bull markets, namely the Fed. If you look at most of the data being published ranging from factory orders, imports, exports, industrial production along with the services sector, not just in the U.S. but China as well, you will notice that all have been in a prolonged downturn. So, will tomorrow’s payroll numbers come to the rescue?

All of our 10 ETFs in the Spotlight followed the “down” theme of 2016 and closed lower. The worst performer of the day was the S&P 500 (SPY) with -2.40%; holding up reasonably well was Consumer Staples (XLP) with -1.20%.

We continue to stay on the sidelines with our Domestic TTI now firmly entrenched in bear market territory. See section 3 below for details.

Read More