
1. Moving the Markets
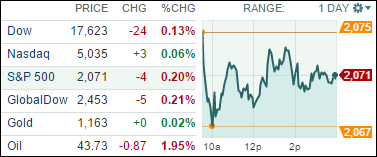
Wall Street, which is riding a four-week winning streak, kicked off a busy week quietly as it awaited a slew of earnings releases, fresh data on the economy and a Wednesday Federal Reserve meeting on interest rates. The S&P 500 and Dow both fell slightly, while the Nasdaq stayed put.
The third-quarter earnings landscape has been better than expected thus far, with 7 out of 10 companies topping sharply reduced forecasts. This week, traders will digest earnings reports from 169 companies in the S&P 500. Major market-moving earnings reports don’t kick in until Tuesday though, when iPhone maker Apple (AAPL), automaker Ford (F), drug makers Merck (MRK) and Pfizer (PFE) and package delivery giant UPS (UPS) report.
We heard some news on the housing market today. Reports came in that sales of new homes plunged sharply in September to the slowest pace in 10 months, as higher prices and slower overall economic growth weigh on the housing market. The slowdown has yet to hit sales of existing homes as drastically, but the September pullback in newly built properties was severe to say the least.
Only 2 of our 10 ETFs in the Spotlight managed to eke out a gain during this sideways trending session. Taking the lead was Consumer Discretionaries (XLY) with +0.70%, while the Mid-Cap Value ETF (IWS) sagged -0.58%.
2. ETFs in the Spotlight
In case you missed the announcement and description of this section, you can read it here again.
It features 10 broadly diversified ETFs from my HighVolume list as posted every Monday. Furthermore, they are screened for the lowest MaxDD% number meaning they have been showing better resistance to temporary sell offs than all others over the past year.
Here are the 10 candidates:
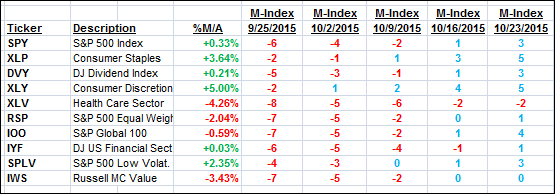
The above table simply demonstrates the magnitude with which some of the ETFs are fluctuating in regards to their positions above or below their respective individual trend lines (%M/A). A break below, represented by a negative number, shows weakness, while a break above, represented by a positive percentage, shows strength.
For hundreds of ETF/Mutual fund choices, be sure to reference Thursday’s StatSheet.
Year to date, here’s how the above candidates have fared so far:
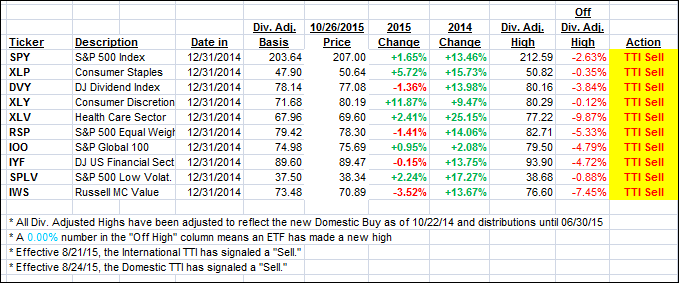
Again, the first table above shows the position of the various ETFs in relation to their respective long term trend lines (%M/A), while the second one tracks their trailing sell stops in the “Off High” column. The “Action” column will signal a “Sell” once the -7.5% point has been taken out in the “Off High” column.
3. Trend Tracking Indexes (TTIs)
Our Domestic Trend Tracking Index (TTI) changed only immaterially today. As I said Friday, I’d like to see a few days of staying power above the line accompanied by a stronger piercing to the upside before issuing a new “Buy” signal for “broadly diversified domestic ETFs/Mutual Funds.” In the meantime, some of the sector funds have shown some nice upward momentum, and I have started to get my feet wet by investing in a few of them this morning with limited exposure.
Here’s how we ended up:
Domestic TTI: +0.30% (last close +0.33%)—Sell signal effective 8/24/2015
International TTI: -2.54% (last close -2.47%)—Sell signal effective 8/21/2015
Disclosure: I am obliged to inform you that I, as well as advisory clients of mine, own some of these listed ETFs. Furthermore, they do not represent a specific investment recommendation for you, they merely show which ETFs from the universe I track are falling within the guidelines specified.
Contact Ulli