
1. Moving the Markets
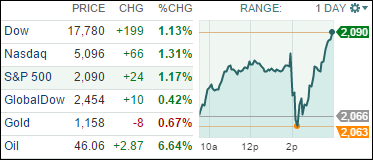
Wall Street at first reacted negatively this morning after the Fed left interest rates unchanged and signaled a December rate hike was still on the table, but then recovered as the afternoon wore on with the Dow ending up nearly 200 points.
In earnings today, we heard from a number of tech companies. Camera maker GoPro (GPRO) disappointed after reporting a lower-than-expected rise in quarterly revenue, citing lower demand for its wearable cameras in the Americas. Twitter (TWTR) bombed on earnings due to slowing user growth. Yelp (YELP), on the other hand, posted a fantastic 40% in quarterly revenue as more local businesses are advertising on its platform.
Apple (AAPL) reported numbers that most analysts were expecting, so the stock did not move too much today. For the September quarter, it earned $1.96 per share on $51.5 billion in revenue and sold 48.05 million iPhones, which is a 22% jump compared to the previous year.
In M&A news, we heard today that IBM has agreed to acquire The Weather Company’s data and digital properties, a deal valued at more than $2 billion. IBM will own mobile and web assets, including weather.com, but it will not own the company’s primary TV asset, the Weather Channel.
9 of our 10 ETFs in the Spotlight closed higher lead by the Financials (IYF) with +2.32% while the only loser of the day was Consumer Staples (XLP) with -0.57%.
2. ETFs in the Spotlight
In case you missed the announcement and description of this section, you can read it here again.
It features 10 broadly diversified ETFs from my HighVolume list as posted every Monday. Furthermore, they are screened for the lowest MaxDD% number meaning they have been showing better resistance to temporary sell offs than all others over the past year.
Here are the 10 candidates:
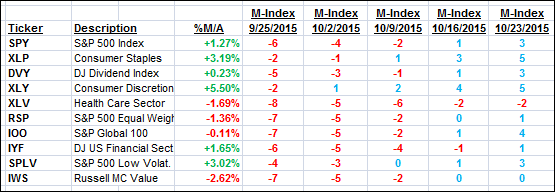
The above table simply demonstrates the magnitude with which some of the ETFs are fluctuating in regards to their positions above or below their respective individual trend lines (%M/A). A break below, represented by a negative number, shows weakness, while a break above, represented by a positive percentage, shows strength.
For hundreds of ETF/Mutual fund choices, be sure to reference Thursday’s StatSheet.
Year to date, here’s how the above candidates have fared so far:
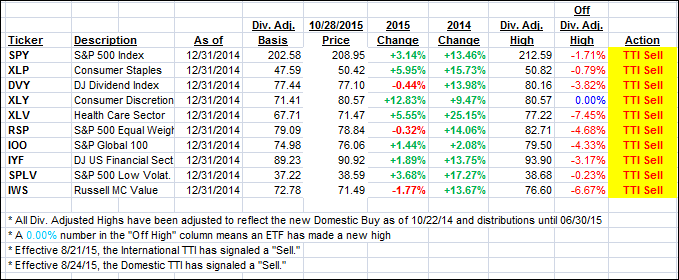
Again, the first table above shows the position of the various ETFs in relation to their respective long term trend lines (%M/A), while the second one tracks their trailing sell stops in the “Off High” column. The “Action” column will signal a “Sell” once the -7.5% point has been taken out in the “Off High” column.
3. Trend Tracking Indexes (TTIs)
Our Domestic Trend Tracking Indexes (TTIs) improved getting us closer to a new domestic Buy signal. I’d like to see a few days of staying power above the line accompanied by a stronger piercing to the upside before issuing a new “Buy” signal for “broadly diversified domestic ETFs/Mutual Funds.”
Here’s how we ended up:
Domestic TTI: +0.64% (last close +0.11%)—Sell signal effective 8/24/2015
International TTI: -2.61% (last close -3.11%)—Sell signal effective 8/21/2015
Disclosure: I am obliged to inform you that I, as well as advisory clients of mine, own some of these listed ETFs. Furthermore, they do not represent a specific investment recommendation for you, they merely show which ETFs from the universe I track are falling within the guidelines specified.
Contact Ulli