
Oil Pushes Markets Down A Slippery Slope

Ulli Market Commentary Contact

Mon pic

[Chart courtesy of MarketWatch.com]

1. Moving the Markets

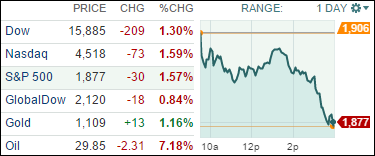
Oil continues to be the dominant market mover in the early days of 2016. Stocks ended lower Monday as oil prices dropped more than 7% and fell back to around $30 a barrel. The drop in oil prices of late is mostly due to global oversupply. It appears that none of the major oil producers are willing to cut production for fear of losing global market share, even though demand has decreased substantially over the past couple of months.

The drop in stocks comes shortly after Wall Street was able to finally bounce back last week in the market’s first week of positive returns for U.S. stocks in the New Year.  But the relief rally, while welcomed and much-needed, wasn’t enough for still-shaken bulls to go out on a limb and send a definitive all-clear signal. That type of signal could most likely only come from the Fed via promises of lower interest rates and/or a new Quantitative Easing (QE) program, despite the now well known fact that QE did nothing for the economy but was instrumental in lifting the fincancial markets to their lofty levels over the past 6 years.

Investors are gearing up for a busy week of earnings, and they’ll be looking beyond the numbers. More than 130 companies in the S&P 500 are scheduled to report their fourth-quarter results this coming week, including moguls like online retailer Amazon.com (AMZN), social media firm Facebook (FB) and tech giants Microsoft (MSFT) and Apple (AAPL). It’s still early in the profit season as only 73 S&P 500 companies have reported so far. Analysts are currently forecasting companies in the S&P 500 to report 5.9% lower fourth-quarter adjusted earnings.

All of our 10 ETFs in the Spotlight headed south led by the Financials (IYF) with -2.16%. Holding up reasonably well was Consumer Staples (XLP) with -0.89%.

Read More

ETFs/Mutual Funds On The Cutline – Updated Through 01/22/2016

Ulli ETFs on the Cutline Contact

Below are the latest ETF Cutline reports, which show how far above or below their respective long-term trend lines (39 week SMA) my currently tracked ETFs/MFs are positioned.

The first report covers the ETF Master List from Thursday’s StatSheet and includes 381 ETFs, of which currently 21 (last week 16) are hovering in bullish territory.

The second report includes only High Volume ETFs. To clarify, High Volume (HV) ETFs are defined as those with an average daily volume of $10 million or higher. Volume figures can change in a hurry, so be sure to check first before investing.

These ETFs are generated from my selected list of 98 that I use in my advisor practice. It cuts out the “noise,” which simply means it eliminates those ETFs that I would never buy because of their volume limitations. 7 ETFs (last week 6) have managed to remain in bullish territory after the recent market volatility.

The third report covers Mutual Funds on the Cutline. There are currently 15 (last week 14) above the line and 766 below it out of the 781 that I follow.

Take a look:

  1. ETF Master Cutline Report
  2. ETF High Volume Cutline Report
  3. MF Cutline Report

In case you are not familiar with some of the terminology used in the reports, please read the Glossary of Terms.

If you missed the original post about the Cutline approach, you can read it here.

One Man’s Opinion: Should Investors Be On Margin Or Leveraged?

Ulli Market Review Contact

ManGeopolitical risks can weigh heavily on capital markets, since investors that know less about China than the US are more concerned about the world’s second largest economy, said Leon Cooperman, CEO of Omega Advisors.

The Chinese market turmoil is very significant for what’s going on in China, but in terms of the global economy, it’s not as significant as people make it out to be. In 2014, rest of the world was worried about a bullish bubble while in 2015 investors were worried about Greece.

In 2016, the rage is China though the developments in US credit market is far more important for US investors. China’s effect on Global GDP is not significant though China’s effect on commodity prices were quite dramatic; stocks of oil, metals etc have been destroyed.

Read More

New ETFs On The Block: FlexShares Real Assets Allocation Index Fund (ASET)

Ulli Infastructure ETFs Contact

91551519While commodity and energy prices have been battered over the past 16 months or so, some investors believe prices have nearly bottomed out and expect them to stabilize very soon.
The Fed hike was a small step toward monetary policy normalization and contrarian investors would probably want to revisit the so called “real asset” class following their dramatic decline.

FlexShares, the exchange-traded fund unit of Northern Trust, recently launched a fund-of-funds to provide exposure to both natural resources and infrastructure. The newly launched FlexShares Real Asset Allocation Index Fund (ASET) holds three other FlexShares ETFs including the FlexShares STOXX Global Broad Infrastructure Index Fund (NFRA), FlexShares Global Quality Real Estate Index Fund (GQRE) and the popular FlexShares Morningstar Global Upstream Natural Resources Index Fund (GUNR).

Read More

ETF/No Load Fund Tracker Newsletter For January 22, 2016

Ulli ETF Tracker Contact

ETF/No Load Fund Tracker StatSheet

————————————————————-

THE LINK TO OUR CURRENT ETF/MUTUAL FUND STATSHEET IS:

https://theetfbully.com/2016/01/weekly-statsheet-for-the-etfno-load-fund-tracker-newsletter-updated-through-01212016/

————————————————————

Market Commentary

DIGGING OUT OF A HOLE

Fri pic

[Chart courtesy of MarketWatch.com]

1. Moving the Markets

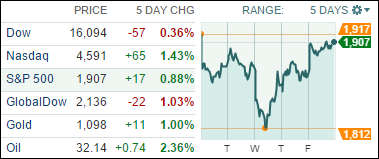
Wall Street stocks scored a second day of gains Friday after a steep sell-off earlier in the week as oil prices bounced sharply higher and investors banked on further stimulus measures from global central banks. Major indexes were higher on the week, with telecom leading advancing sectors and financials the only declining sector. Even after this week-ending rebound, all three U.S. stock indexes remain in correction territory, commonly defined as a drop of 10% or more from recent highs and, of course, confirmed by our Domestic TTI being trapped below its long-term trend line.

Powering Day 2 of the rebound was a big rally in the oil patch, where a barrel of U.S.-produced crude was up more than 8% and back above $32 a barrel. Plunging crude prices, of course, have weighed on stocks this year, as it has raised fears of a coming global slowdown and worries that bankruptcies and upheaval in the oil sector would exacerbate financial tumult.

Economic news was mixed overall for the week, with housing and manufacturing data representing the most significant releases of the week. While the pace of U.S. economic growth appears to have slowed some more recently, it continues to remain on plus side—so far but only barely.

Heading into next week, Wednesday’s Federal Open Market Committee (FOMC) rate decision should be the marquee event of the week. Other major economic reports include the S&P/Case-Shiller home price index and consumer confidence on Tuesday, durable goods orders on Thursday, and fourth-quarter GDP on Friday.

All of our 10 ETFs in the Spotlight joined the 24-hour party and closed up with the Global 100 (IOO) leading the pack with a gain of +2.43%, while Consumer Staples (XLP) lagged but still showed a good performance with +1.71%.

Read More

Weekly StatSheet For The ETF/No Load Fund Tracker Newsletter – Updated Through 01/21/2016

Ulli ETF StatSheet Contact

ETF/Mutual Fund Data updated through Thursday, January 21, 2016

TOC010716

If you are not familiar with some of the terminology used, please see the Glossary of Terms.


1. DOMESTIC EQUITY MUTUAL FUNDS/ETFs: SELL — since 11/13/2015

TTI

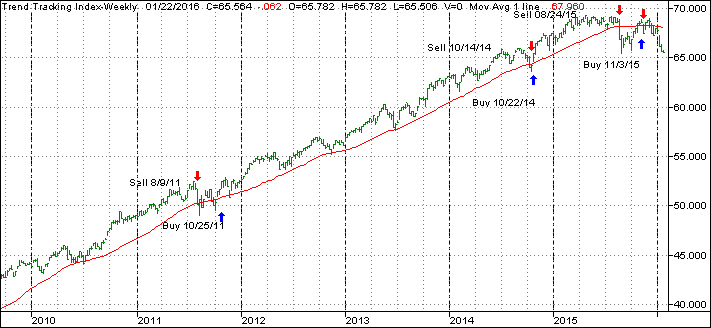
Our main directional indicator, the Domestic Trend Tracking Index (TTI-green line in above chart) has recently crawled above its long term trend line (red) and finally generated a new “Buy” signal effective 11/3/15. The market subsequently dropped, and we exited again on 11/13/15. As of today, the TTI remains below its trend line by -3.65%, which means we are in cash on the sidelines.

Read More