Markets Bounce Back After Shaky Week

Ulli Market Commentary Contact

Mon pic

[Chart courtesy of MarketWatch.com]

1. Moving the Markets

I received a number of emails from readers over the weekend being glad to be out of the market especially in view of the sudden tragic events in France. The general theme was that the indexes would take another hit, but that was not to be. While the futures pointed to a lower opening, momentum turned positive, and the markets never looked back despite dismal economic data (Japan in the 5th recession in 5 years and poor US manufacturing data).

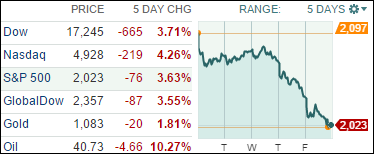
All major U.S. indexes gained more than 1% to start the week, recovering from a volatile week prior. Oil prices were a prominent mover today and led the energy sector higher as U.S. crude rose about 2.45% to close at $41.74 a barrel.

As you would expect from any ground shaking terrorist attack, the airline industry took a blow today following the news from Paris last Friday. Shares of American Airlines (AAL), Delta Air Lines (DAL), and United Continental (UAL) had already started to give up their October gains last week, and they all fell again by 2%-3% today. In Europe, Air France and British Airways owner IAG lost 5% and 3% respectively. French hotel group Accor also lost 5%.

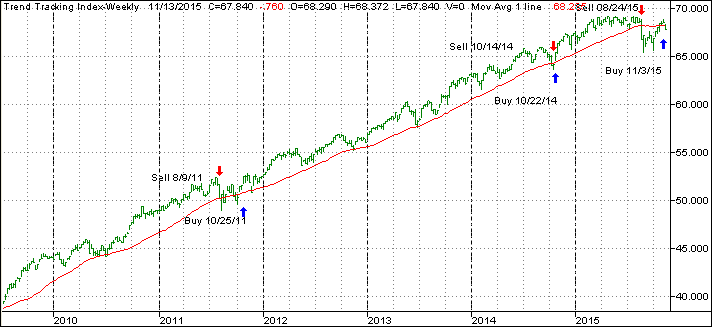
The big question: Is today’s rebound simply a dead cat bounce or the beginning of another trend reversal? We won’t know and will remain on the sidelines until we get confirmation that a new uptrend is indeed in place. The chart patterns, the volatility as of recent and the non-directional meandering appear to point towards one thing: A final blow-off in this bull market. As I was pondering this possibility, I came across this piece titled Stock market enters final bull market stage.

In a reversal from last week, all of our 10 ETFs in the Spotlight followed the indexes higher led by Consumer Staples (XLP) with +1.71%, while Consumer Discretionaries (XLY) lagged with +1.21%.

Read More

ETFs/Mutual Funds On The Cutline – Updated Through 11/13/2015

Ulli ETFs on the Cutline Contact

Below are the latest ETF Cutline reports, which show how far above or below their respective long-term trend lines (39 week SMA) my currently tracked ETFs/MFs are positioned.

The first report covers the ETF Master List from Thursday’s StatSheet and includes 381 ETFs, of which currently 22 (last week 97) are hovering in bullish territory.

The second report includes only High Volume ETFs. To clarify, High Volume (HV) ETFs are defined as those with an average daily volume of $10 million or higher. Volume figures can change in a hurry, so be sure to check first before investing.

These ETFs are generated from my selected list of some 97 that I use in my advisor practice. It cuts out the “noise,” which simply means it eliminates those ETFs that I would never buy because of their volume limitations. 5 ETFs (last week 17) have managed to remain in bullish territory after the recent market volatility.

The third report covers Mutual Funds on the Cutline. There are currently 61 (last week 315) above the line and 739 below it out of the 800 that I follow.

Take a look:

  1. ETF Master Cutline Report
  2. ETF High Volume Cutline Report
  3. MF Cutline Report

In case you are not familiar with some of the terminology used in the reports, please read the Glossary of Terms.

If you missed the original post about the Cutline approach, you can read it here.

One Man’s Opinion: Is There A Strong Disconnect Between High-Yield Valuations And Fundamentals?

Ulli Market Review Contact

ManThe Fed is expected to hike rates in December as the stars have aligned over the past few weeks: the Fedspeak, the economic data and markets are all priced-in and well anticipated and nobody would be surprised, said John Bellows of Western Asset Management.

But the bigger question remains what would drive long-term bond yields and it’s unlikely a 25 basis points change at the front-end of the yield curve would make a big impact to 10-year and 30-year maturity bonds as they are driven much more by inflation and growth. Investors would be better served if they look at fundamentals rather than focusing on the Fed, he noted.

US 10-year Treasury yields have jumped to more than 2.3 percent, indicating the bond-market has already moved even though the Fed has not officially moved yet. Asked to comment, John said investors need to look at different asset classes from a perspective; equities have generally done quite well in a risk-on environment and economic data have stabilized, which have contributed to the upward pressure on yields as well.

Read More

New ETFs On The Block: ProShares S&P 500 Ex-Sector ETFs

Ulli Sector ETFs Contact

91551519Investors that believe in passive investment strategies by replicating the broader US market – the S&P 500 index – may not be very happy about the market’s performance year-to-date. Relentless worries over global growth, be it China, Japan, Europe or the emerging markets, the index got hammered several times this year.

Empirical data show severe downturn even in one sector is good enough to bring the markets down to their knees; for example at the turn of the century it was the tech/dot-com bubble, and more recently in 2008 the sub-prime crisis in the financial services sector triggering a full-blown global recession.

Needless to say, amidst such historical evidence, debates are raging if the plunging oil prices and accompanying defaults by energy companies could spark another financial crisis. Hence excluding certain sectors that are likely to underperform could be one obvious investment call.

Read More

ETF/No Load Fund Tracker Newsletter For November 13, 2015

Ulli ETF Tracker Contact

ETF/No Load Fund Tracker StatSheet

————————————————————-

THE LINK TO OUR CURRENT ETF/MUTUAL FUND STATSHEET IS:

https://theetfbully.com/2015/11/weekly-statsheet-for-the-etfno-load-fund-tracker-newsletter-updated-through-11122015-2/

————————————————————

Market Commentary

DIVE ON WALL STREET CONTINUES; DOMESTIC TTI SELL SIGNAL CONFIRMED

Fri pic

[Chart courtesy of MarketWatch.com]

1. Moving the Markets

Stocks fell sharply again Friday as Wall Street suffered a third straight day of losses and the worst weekly loss in 10 weeks.

It seems investors are finding more reasons to hold off on buying stocks, with worries ranging from overvalued stocks, higher interest rates, weak results from key retailers like Macy’s (M) and ongoing angst over the impact of China’s economic slowdown.

Traders were also digesting October retail sales numbers that disappointed, which added to more recent fears about the strength of the Holiday selling season prompted by weak earnings and guidance from department stores Macy’s and Nordstrom.

Oil prices continued to fall as well today, as the U.S. benchmark crude was on the verge of dropping below $40 a barrel. West Texas Intermediate crude dropped 2% to $40.77 a barrel.

This morning, when checking the markets, I was greeted with a sea of red numbers around the world. So I did what I posted yesterday by not only liquidating some of our sector funds but I opted to go to cash 100%. Good thing as the downside momentum accelerated into the close, which may not bode well for Monday’s opening.

This brings to an end a very short domestic Buy cycle, which lasted barely 10 days. Again, the idea of Trend Tracking is to sidestep portfolio destroying bear markets. To accomplish this goal, we will have to occasionally participate in “whip-saw” signals, which are simply a form of insurance we have to pay in order to avoid a potential disaster. For the exact TTI numbers, please see section 3 below.

As the sell-off gained steam, all of our 10 ETFs in the Spotlight headed south with the worst performer of the day being Consumer Discretionaries (XLY) by surrendering -2.63%. Holding up well was Healthcare (XLV), which posted a modest -0.24% loss.

Read More

Weekly StatSheet For The ETF/No Load Fund Tracker Newsletter – Updated Through 11/12/2015

Ulli ETF StatSheet Contact

ETF/Mutual Fund Data updated through Thursday, November 12, 2015

TOC110515

If you are not familiar with some of the terminology used, please see the Glossary of Terms.


1. DOMESTIC EQUITY MUTUAL FUNDS/ETFs: BUY — since 11/04/2015

TTI

Our main directional indicator, the Domestic Trend Tracking Index (TTI-green line in above chart) has recently crawled above its long term trend line (red) and finally generated a new “Buy” signal effective 11/3/15. However, this week’s market action has pulled this index -0.67% below its long term trend line putting us on the cusp of a “Sell” signal. Please see today’s blog post for important details.

Read More