
1. Moving the Markets
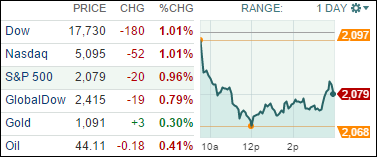
Stocks slipped to kick off a new week of trading. It seemed as if investors are adjusting their portfolios for a likely interest rate hike from the Fed in December after an allegedly strong reading on jobs growth in October. All indexes fell about 1% on the day.
With third quarter earnings season wrapping up, investors are now looking to see how the end of the year will unfold in regards to corporate profits. The general consensus amongst analysts at present is that the fourth quarter won’t be any more impressive than the third. Companies in the S&P 500 are expected to post 3.7% lower adjusted profit in the final quarter of 2015.
If these predictions are correct, it would mark the second quarter in a row for declines. All but 50 of the companies in the S&P 500 have reported third-quarter results and profits are down about 1.6%, according to Cap IQ.
We heard an interesting bit of info from United Arab Emirates’ energy minister today. In a statement to the press, he said he believes oil prices will have a correction next year, partly due to the fact that he anticipates the UAE will increase daily production to 3.5 million barrels. The Emirates currently produces about 2.9 million barrels of oil a day and was the sixth-largest oil producer in 2014. If that comes true, the US fracking industry will be in for a world of hurt.
None of our 10 ETFs in the Spotlight was able to buck the trend and close above the unchanged line. The bears were clearly in charge today pushing all indexes lower with Consumer Discretionaries (XLY) giving back -1.38%, while the Dividend ETFs (DVY) held up the best by surrendering only -0.48%.
The Domestic TTI headed south and broke its trend line by a tiny -0.01%. Please see section 3 for important details.
2. ETFs in the Spotlight
In case you missed the announcement and description of this section, you can read it here again.
It features 10 broadly diversified ETFs from my HighVolume list as posted every Monday. Furthermore, they are screened for the lowest MaxDD% number meaning they have been showing better resistance to temporary sell offs than all others over the past year.
Here are the 10 candidates:
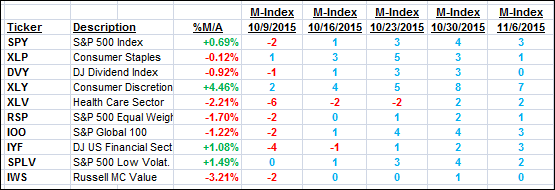
The above table simply demonstrates the magnitude with which some of the ETFs are fluctuating in regards to their positions above or below their respective individual trend lines (%M/A). A break below, represented by a negative number, shows weakness, while a break above, represented by a positive percentage, shows strength.
For hundreds of ETF/Mutual fund choices, be sure to reference Thursday’s StatSheet.
Year to date, here’s how the above candidates have fared so far:
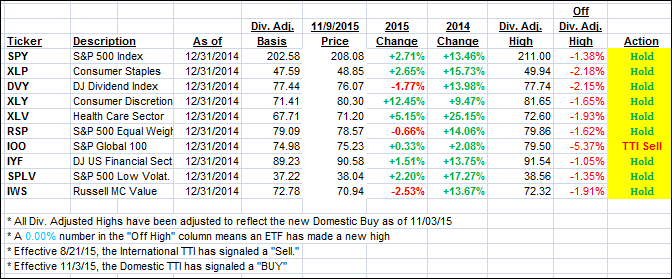
Again, the first table above shows the position of the various ETFs in relation to their respective long term trend lines (%M/A), while the second one tracks their trailing sell stops in the “Off High” column. The “Action” column will signal a “Sell” once the -7.5% point has been taken out in the “Off High” column.
3. Trend Tracking Indexes (TTIs)
Our Domestic Trend Tracking Index (TTI) slipped today and crossed its long term trend line to the downside—but only by a fraction of a percent. Again, in order to avoid a whip-saw signal (A “Sell” followed quickly by a “Buy”), we need to see a clear and consistent break below the line before considering this current Buy cycle to be over.
It’s too early to tell for sure, but this insane October rebound could very well turn out to be one big dead cat bounce if the indexes lose their footing and head further south causing us to be caught in a whip-saw signal. While that is an inconvenience, we need to keep in mind that it is a necessary evil in our attempt to avoid portfolio destruction by not participating in major bear markets such as in 2001 and 2008. Only with the benefit of hindsight will we know whether a market pullback was just minor or if it turned into a full fledged bearish disaster.
Here’s how we ended up:
Domestic TTI: -0.01% (last close +0.44%)—Buy signal effective 11/3/2015
International TTI: -3.31% (last close -2.71%)—Sell signal effective 8/21/2015
Disclosure: I am obliged to inform you that I, as well as advisory clients of mine, own some of these listed ETFs. Furthermore, they do not represent a specific investment recommendation for you, they merely show which ETFs from the universe I track are falling within the guidelines specified.
Contact Ulli