S&P 500 Tries To Escape Correction Zone, But Big Week Looms Ahead

Ulli Market Commentary Contact

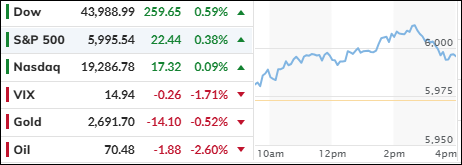
[Chart courtesy of MarketWatch.com]

  1. Moving the markets

Stocks bounced back on Monday after a brutal beating in the past few weeks. The S&P 500 tried to escape the correction zone, as traders braced for a busy week of Fed, jobs, and Apple news.

It was about time for some relief from the oversold madness. The rally was widespread, with all 11 sectors of the S&P 500 in the green. Tech, consumer, and communication stocks led the way. Big tech giants like Amazon and Meta Platforms gained more than 2% each.

The rebound followed a dismal week for the S&P 500, which dropped 2.5% and more than 10% from its 2023 peak. It’s down 3% for October, heading for its worst three-month streak since the pandemic hit in 2020.

The Fed will announce its rate decision on Wednesday, and most traders expect no change. With soaring interest rates blamed for the market slump, traders hope the Fed will hint at a pause in rate hikes and keep the Santa Claus rally alive.

The 10-year Treasury yield spiked above 5% last week but eased to around 4.9% on Monday.

The October jobs report will come out on Friday, and investors hope for some cooling in the labor market that will make the Fed more relaxed. Apple will release its earnings on Thursday after the market closes. The largest stock in the S&P 500 is also in a correction, down 15% from its record high.

In the end, traders were glad that WW3 didn’t erupt over the weekend, which boosted their mood. Financial stocks did well, with the KBW Bank index recovering from Friday’s losses. Tesla missed out on the party due to worries about battery supply. Despite some help from short squeezers, most shorted stocks ended flat, as they ran out of steam.

Looking at the big picture, ZeroHedge noted that without the Mag 7 stocks, most equity indices are below their 200-week averages and negative for the year, as this chart shows. Ouch indeed.

Bond yields rose slightly, with the 30-year bouncing off its 5% level twice. The dollar weakened, gold fell from its highs but stayed above $2k, and crude oil plunged 4%.

Financial conditions keep getting tighter, which makes me wonder: how much will this hurt the economy, and when will we feel it?

Read More

ETFs On The Cutline – Updated Through 10/27/2023

Ulli ETFs on the Cutline Contact

Do you want to know which ETFs are hot and which ones are not? Then you need my High-Volume ETF Cutline report. It tells you how close or far each of the 311 ETFs I follow is from its long-term trend line (39-week SMA). These are the ETFs that trade more than $5 million a day, so they are not some obscure funds that nobody cares about.

The report is split into two parts: The winners that are above their trend line (%M/A), and the losers that are below it. The yellow line is the line of shame that separates them. You can see how many ETFs are in each group and how they have changed since the last report (51 vs. 36 current).

Take a peek:

The HV ETF Master Cutline Report

If you are confused by some of the terms we use, don’t panic. I have a helpful Glossary of Terms for you.

If you want to learn more about the Cutline method and how it can make you rich (or at least less poor), read my original post here.

ETF Tracker Newsletter For October 27, 2023

Ulli ETF Tracker Contact

ETF Tracker StatSheet          

You can view the latest version here.

THE GOOD, THE BAD, AND THE UGLY: AMAZON OUTPERFORMS, BUT MARKET UNDERWHELMS

[Chart courtesy of MarketWatch.com]

  1. Moving the markets

The Nasdaq tried to bounce back on Friday after a brutal week, but the S&P 500 was not in the mood and slipped into correction mode. Amazon was the star of the show, delivering a stellar quarter that beat Wall Street’s forecasts. The stock jumped more than 6% and lifted other tech giants like Alphabet and Microsoft.

Other earnings were not so rosy. Ford plunged more than 10% after missing its targets and blaming the UAW strike. Chevron also disappointed investors and shed more than 4%.

Inflation was on everyone’s mind as the Fed’s favorite measure, the core PCE, came out. It rose 0.3% in September and 3.7% year over year, in line with expectations. Consumer spending also beat estimates, rising 0.7%.

But none of that could save the market from a dismal week. The Dow, the S&P 500, and the Nasdaq all lost more than 2%, dragged down by Meta Platforms and Alphabet’s woes.

The big picture was not much better. US macro data was surprisingly strong, but financial conditions were tight, as this chart shows. Inflation expectations diverged sharply between the market and consumers. Who has it right?

Gold and oil went on a roller coaster ride, as the Middle East conflict escalated and de-escalated.

The major indexes gave up their early gains and closed lower. The Nasdaq suffered another losing week, and so did the Magnificent 7, hitting their lowest level since May 2023. Banks also took a beating. The equal-weight S&P hit a one-year low, and the cap-weighted S&P was catching up fast.

Bond yields retreated after spiking earlier in the week, the dollar edged higher, oil dropped 4%, but gold soared on Gaza fears and broke above $2k, its highest since May.

Interestingly, gold is now rising with bond yields, a rare occurrence indeed. Is this a sign of trouble for the dollar?

Read More

Weekly StatSheet For The ETF Tracker Newsletter – Updated Through 10/26/2023

Ulli ETF StatSheet Contact

ETF Data updated through Thursday, October 26, 2023

How to use this StatSheet:

  1. Out of the 1,800+ ETFs out there, I only pick the ones that trade over $5 million per day (HV ETFs), so you don’t get stuck with a lemon that nobody wants to buy or sell.
  1. Trend Tracking Indexes (TTIs)

These are the main indicators that tell you when to buy or sell Domestic and International ETFs (section 1 and 2). They do that by comparing their position to their long-term M/A (Moving Average). If they cross above, and stay there, it’s a green light to buy. If they fall below, and keep going, it’s a red light to sell. And to make sure you don’t lose your shirt if things go south, I also use a 12% trailing stop loss on all positions in these categories.

  1. All other investment areas don’t have a TTI and should be traded based on the position of each ETF relative to its own trend line (%M/A). That’s why I call them “Selective Buy.” In other words, if an ETF goes above its own trend line, you can buy it. But don’t forget to use a trailing sell stop of 12%, or less if you’re feeling nervous.

If some of these words sound like Greek to you, please check out the Glossary of Terms and new subscriber information in section 9.

  1. DOMESTIC EQUITY ETFs: SELL— since 09/22/2023

Click on chart to enlarge

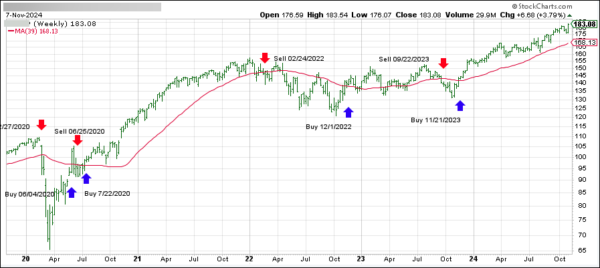
This is our main compass, the Domestic Trend Tracking Index (TTI-green line in the above chart). It has now broken below its long-term trend line (red) by -6.75% and has moved into “Sell” mode effectively 9/22/2023.

Read More

Bond Yields Bite Big Tech: Nasdaq And S&P 500 Join Correction Club

Ulli Market Commentary Contact

[Chart courtesy of MarketWatch.com]

  1. Moving the markets

It was another brutal day for stocks, as the Nasdaq Composite plunged deeper into the red zone, thanks to Meta’s disappointing earnings. The tech giant formerly known as Facebook failed to wow investors with its metaverse vision, and its stock dropped more than 10%.

The Nasdaq Composite is now down more than 10% from its July high, joining the correction club with the S&P 500, which also slipped below that mark today.

The main culprit behind this sell-off is the rising bond yields, which make stocks look less attractive. The 10-year Treasury yield flirted with 5% this month, a level not seen since 2007, before settling at 4.848% today.

Big tech earnings have been a mixed bag so far, and the market is not impressed. Amazon and Apple are the last ones to report this week, but they face a tough challenge amid the slowing US economy and the supply chain woes.

The third-quarter GDP report did not help either, as it showed that the US economy grew faster than expected, at 4.9% annualized. This might sound like good news, but it also means that the Fed has less reason to cut rates or ease its monetary policy.

The Magnificent 7 stocks, which include Meta, Amazon, Apple, Microsoft, Google, Netflix, and Tesla, have lost about $1 trillion in market value in the last two weeks, as bond yields and big tech moved in opposite directions.

The market also shrugged off some attempts to spark a rally, such as short squeezes, gold prices, or oil prices.

The AI boom/covid/crypto boom/bust cycle is still in play, and it does not look pretty. Can Amazon save the day with its earnings report later today? Or will it be another nail in the coffin for the tech sector?

Read More

Market Suffers As Alphabet Disappoints, Bond Yields Spook Growth Investors

Ulli Market Commentary Contact

[Chart courtesy of MarketWatch.com]

  1. Moving the markets

The market went down the drain on Wednesday, thanks to Alphabet’s disappointing cloud numbers that dragged down the whole tech sector. The 10-year Treasury yield also bounced back above 4.95%, spooking growth investors and sending the 30-year above 5% again.

Alphabet stock plunged over 9%, its worst drop since last October, as its cloud revenue fell short of expectations, despite its overall strong performance. Apple and Amazon also slipped 1% and 2.5%, respectively, pushing the S&P 500 to its lowest level since June and breaking the key 4,200 support.

Amazon will report its third-quarter results after the market closes on Thursday. Will it be able to lift the spirits of the tech investors, or will it add more fuel to the fire?

Meanwhile, the bond market remains the center of attention, as the yields are soaring at a rate not seen since 1982. That’s bad news for stocks, especially the high-flying ones.

The short squeeze craze fizzled out today, as the most shorted stocks got hammered. The tech and consumer discretionary sectors were the worst performers today, while energy, staples, and utilities were the best.

Banks had a wild ride, crude oil recovered from its lows, gold flirted with $2k, and the dollar continued its rally.

Can IBM and Meta save the day with their earnings reports this afternoon, or will they join the tech wreck?

Read More