

1. Moving the Markets
I received a number of emails from readers over the weekend being glad to be out of the market especially in view of the sudden tragic events in France. The general theme was that the indexes would take another hit, but that was not to be. While the futures pointed to a lower opening, momentum turned positive, and the markets never looked back despite dismal economic data (Japan in the 5th recession in 5 years and poor US manufacturing data).
All major U.S. indexes gained more than 1% to start the week, recovering from a volatile week prior. Oil prices were a prominent mover today and led the energy sector higher as U.S. crude rose about 2.45% to close at $41.74 a barrel.
As you would expect from any ground shaking terrorist attack, the airline industry took a blow today following the news from Paris last Friday. Shares of American Airlines (AAL), Delta Air Lines (DAL), and United Continental (UAL) had already started to give up their October gains last week, and they all fell again by 2%-3% today. In Europe, Air France and British Airways owner IAG lost 5% and 3% respectively. French hotel group Accor also lost 5%.
The big question: Is today’s rebound simply a dead cat bounce or the beginning of another trend reversal? We won’t know and will remain on the sidelines until we get confirmation that a new uptrend is indeed in place. The chart patterns, the volatility as of recent and the non-directional meandering appear to point towards one thing: A final blow-off in this bull market. As I was pondering this possibility, I came across this piece titled Stock market enters final bull market stage.
In a reversal from last week, all of our 10 ETFs in the Spotlight followed the indexes higher led by Consumer Staples (XLP) with +1.71%, while Consumer Discretionaries (XLY) lagged with +1.21%.
2. ETFs in the Spotlight
In case you missed the announcement and description of this section, you can read it here again.
It features 10 broadly diversified ETFs from my HighVolume list as posted every Monday. Furthermore, they are screened for the lowest MaxDD% number meaning they have been showing better resistance to temporary sell offs than all others over the past year.
Here are the 10 candidates:
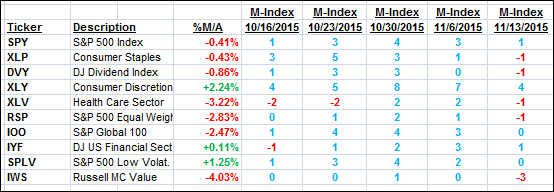
The above table simply demonstrates the magnitude with which some of the ETFs are fluctuating in regards to their positions above or below their respective individual trend lines (%M/A). A break below, represented by a negative number, shows weakness, while a break above, represented by a positive percentage, shows strength.
For hundreds of ETF/Mutual fund choices, be sure to reference Thursday’s StatSheet.
Year to date, here’s how the above candidates have fared so far:
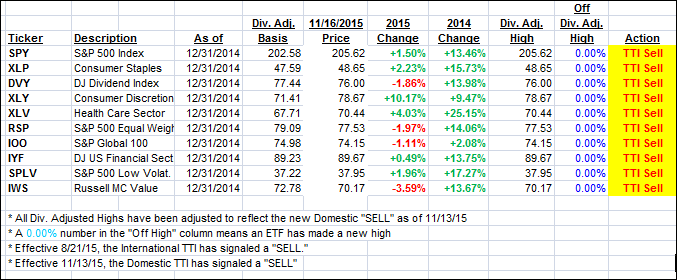
Again, the first table above shows the position of the various ETFs in relation to their respective long term trend lines (%M/A), while the second one tracks their trailing sell stops in the “Off High” column. The “Action” column will signal a “Sell” once the -7.5% point has been taken out in the “Off High” column.
3. Trend Tracking Indexes (TTIs)
Our Domestic Trend Tracking Index (TTI) recovered some but remains stuck on the bearish side of its trend line.
Here’s how we ended up:
Domestic TTI: -0.51% (last close -1.17%)—Sell signal effective 11/13/2015
International TTI: -4.53% (last close -5.05%)—Sell signal effective 8/21/2015
Disclosure: I am obliged to inform you that I, as well as advisory clients of mine, own some of these listed ETFs. Furthermore, they do not represent a specific investment recommendation for you, they merely show which ETFs from the universe I track are falling within the guidelines specified.
Contact Ulli