One Man’s Opinion: Will Junk Bond Defaults Go Up If Oil Remains At Current Levels?

Ulli Market Review Contact

ManThe US economy would certainly not witness a 2008-style recession despite the recent sell-out in the junk-bond market, said Jeffery Gundlach, co-founder and CEO of DoubleLine Capital.

The crises that started in 2008 are rare and seldom repeat themselves. It was probably and hopefully an once-in-a-lifetime event. Nevertheless, the condition in the junk-bond market is disconcerting though, but it’s really centered on commodity prices as opposed to financial leverage, which was the case in 2008.

Low commodity and oil prices are problematic for the junk-bond market because there’s a substantial fraction that is associated with materials, mining and energy. Increasingly, as oil stays where it is now, investors will find junk-bond markets populated with greater shares of these types of sub-sectors because the investment-grade bonds that were rated BBB are likely to get downgraded.

Read More

New ETFs On The Block: PowerShares S&P 500 Momentum Portfolio (SPMO)

Ulli Equity ETFs Contact

Financial DataFactor-based investing has been quite popular within the investment community and, at a time when valuations seem a little stretched, momentum factor based strategies managed to find increasing favor with investors.

PowerShares, the fourth-largest US issuer of exchange-traded funds and one of the biggest purveyors of factor-based investment, recently added a momentum factor based ETF to their lineup after the firm’s fairly successful previous products such as the PowerShares DWA Tactical Sector Rotation Portfolio (DWTR) and the PowerShares S&P 500 Low Volatility Portfolio (SPLV).

The newly minted PowerShares S&P 500 Momentum Portfolio (SPMO) tracks the performance of the S&P 500 Momentum Index and generally invests at least 90 percent of its total assets in stocks that are constituents of the index. The index consists of 101 stocks that have the highest momentum score from the broader S&P 500 universe.

Read More

ETF/No Load Fund Tracker Newsletter For December 18, 2015

Ulli Market Commentary Contact

ETF/No Load Fund Tracker StatSheet

————————————————————-

THE LINK TO OUR CURRENT ETF/MUTUAL FUND STATSHEET IS:

https://theetfbully.com/2015/12/weekly-statsheet-for-the-etfno-load-fund-tracker-newsletter-updated-through-12172015/

————————————————————

Market Commentary

EQUITIES GET SPANKED BY SLIDING CRUDE PRICES AND OPTIONS EXPIRY

 Fri pic

 [Chart courtesy of MarketWatch.com]

1. Moving the Markets

One look at the above chart tells the story. The euphoric “Fed High” did not last, the morning after hangover sat it in and the major indexes took a steep dive over the past 2 days closing the week lower but not by much. The S&P and Dow had their worst 2-day performance since September 1.

The culprits to this week’s debacle were the usual suspects: The continued swoon of oil prices, what the Fed’s announcement really means, a weakening global economy and the event du jour was quadruple options expiration day. The chart definitely resembles a black diamond slope with the indexes closing at their lowest point of the day, which may not bode well for Monday’s opening.

With the holidays upon us, I expect volume to slow down, and it remains to be seen if that might contribute to a Santa Claus rally next week.

All of our 10 ETFs in the Spotlight headed south as equities got hammered. The surprising leader to the downside was the conservative Consumer Staples ETF (XLP) with -2.49%, while the Mid-Cap Value (IWS) was the best performer with a loss of “only” -1.48%.

Our bearish outlook was confirmed again, as section 3 below shows, and a 100% cash position is my preferred choice.

Read More

Weekly StatSheet For The ETF/No Load Fund Tracker Newsletter – Updated Through 12/17/2015

Ulli ETF StatSheet Contact

ETF/Mutual Fund Data updated through Thursday, December 17, 2015

TOC 111915

If you are not familiar with some of the terminology used, please see the Glossary of Terms.


1. DOMESTIC EQUITY MUTUAL FUNDS/ETFs: SELL — since 11/13/2015

TTI

Our main directional indicator, the Domestic Trend Tracking Index (TTI-green line in above chart) has recently crawled above its long term trend line (red) and finally generated a new “Buy” signal effective 11/3/15. The market subsequently dropped, and we exited again on 11/13/15. As of today, the TTI remains below its trend line by -0.77%, which means we are in cash on the sidelines.

Read More

The Morning After: Bulls On Fed Hike Take A Hike

Ulli Market Commentary Contact

Thur pic

[Chart courtesy of MarketWatch.com]

1. Moving the Markets

Wall Street’s enthusiasm over the Federal Reserve’s interest rate hike proved short-lived as stocks sold off sharply today, led by the energy sector, after oil prices fell below $35 a barrel. Although equities rallied briefly at the opening bell and looked ready to build on a three-day winning streak, the gains quickly evaporated as broader market indexes dropped.

The major culprit was oil prices, as U.S. benchmark crude dropped more than 2% to $34.69 a barrel, the lowest since February 2009, which dragged the energy sector down with it. As I mentioned yesterday, a ban on U.S. oil export is in the midst of being lifted. And the news today was that the world’s biggest oil producers in OPEC forecasted a scant chance for a meaningful oil price rise in 2016. Extra Iranian production was expected to add to the global glut, while voluntary output cuts looked remote.

On the economic front, initial jobless claims declined last week, while continuing claims slightly increased. It will be interesting to see how the December numbers for the U.S. economy impact the sentiment of the market heading into 2016.

In a complete reversal from yesterday, all of our 10 ETFs in the Spotlight surrendered their gains and closed lower. Giving up the most was the Equal Weight S&P (RSP) with -1.69%, while the Low Volatility S&P (SPLV) held up best with -1.00%.

Read More

Rate Hike Receives Warm Winter Welcome; Oil Export Ban Lifted

Ulli Market Commentary Contact

Wed pic

[Chart courtesy of MarketWatch.com]

1. Moving the Markets

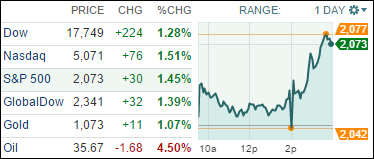
Heading into decision day for the Fed, skeptics warned that an increase in rates could cause market volatility and upheaval. Well, the exact opposite happened today as it seems that Wall Street bulls viewed the Fed’s rate hike as a sign of an improving economy. The question in my mind is as to whether this euphoric reaction represents simply a relief rally or the continuation of the bullish trend. We’ll have to be patient and give it a little time to see if upward momentum can be maintained.

The Fed delivered the news in a policy statement, which read: “Given the economic outlook, and recognizing the time it takes for policy actions to affect future economic outcomes, the Committee decided to raise the target range for the federal funds rate to 0.25% to 0.50%”.

Wall Street also got the forward guidance it wanted to so hear on the pace of future hikes in 2016: “The Committee expects that economic conditions will evolve in a manner that will warrant only gradual increases,” the statement read. The key word, of course, was “gradual.”

In oil news today, we heard that congress reached a deal late Tuesday on a $1.1 trillion spending bill that would end the four-decade-long ban on most U.S. exports of crude oil. Facing plunging revenue and profits, U.S. oil and gas companies have announced 250,000 layoffs this year, according to a November report by consultant Graves & Co. that was cited by Bloomberg. The fact that U.S. producers may finally be allowed to sell unrefined crude oil to foreign customers is a welcome development to the industry but hardly a boon to the bottom line.

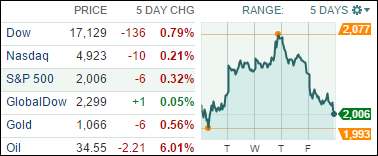
All of our 10 ETFs in the Spotlight headed higher as the rebound continued. Consumer Staples (XLP) led with +1.93%, while the Mid-Cap Value (IWS) lagged but still gained +1.21%.

Read More