
1. Moving the Markets
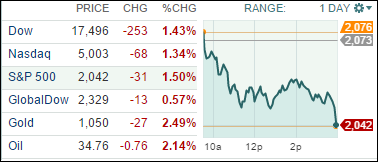
Wall Street’s enthusiasm over the Federal Reserve’s interest rate hike proved short-lived as stocks sold off sharply today, led by the energy sector, after oil prices fell below $35 a barrel. Although equities rallied briefly at the opening bell and looked ready to build on a three-day winning streak, the gains quickly evaporated as broader market indexes dropped.
The major culprit was oil prices, as U.S. benchmark crude dropped more than 2% to $34.69 a barrel, the lowest since February 2009, which dragged the energy sector down with it. As I mentioned yesterday, a ban on U.S. oil export is in the midst of being lifted. And the news today was that the world’s biggest oil producers in OPEC forecasted a scant chance for a meaningful oil price rise in 2016. Extra Iranian production was expected to add to the global glut, while voluntary output cuts looked remote.
On the economic front, initial jobless claims declined last week, while continuing claims slightly increased. It will be interesting to see how the December numbers for the U.S. economy impact the sentiment of the market heading into 2016.
In a complete reversal from yesterday, all of our 10 ETFs in the Spotlight surrendered their gains and closed lower. Giving up the most was the Equal Weight S&P (RSP) with -1.69%, while the Low Volatility S&P (SPLV) held up best with -1.00%.
2. ETFs in the Spotlight
In case you missed the announcement and description of this section, you can read it here again.
It features 10 broadly diversified ETFs from my HighVolume list as posted every Monday. Furthermore, they are screened for the lowest MaxDD% number meaning they have been showing better resistance to temporary sell offs than all others over the past year.
Here are the 10 candidates:
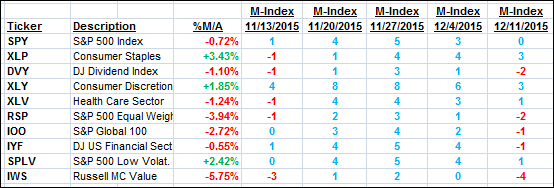
The above table simply demonstrates the magnitude with which some of the ETFs are fluctuating in regards to their positions above or below their respective individual trend lines (%M/A). A break below, represented by a negative number, shows weakness, while a break above, represented by a positive percentage, shows strength.
For hundreds of ETF/Mutual fund choices, be sure to reference Thursday’s StatSheet.
Year to date, here’s how the above candidates have fared so far:
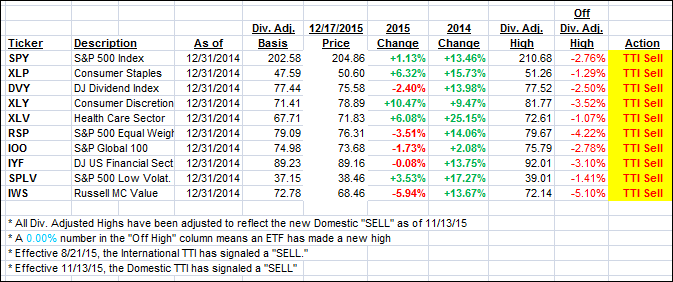
Again, the first table above shows the position of the various ETFs in relation to their respective long term trend lines (%M/A), while the second one tracks their trailing sell stops in the “Off High” column. The “Action” column will signal a “Sell” once the -7.5% point has been taken out in the “Off High” column.
3. Trend Tracking Indexes (TTIs)
Our Domestic Trend Tracking Index (TTI) reversed as the indexes gave up yesterday’s gains as were equities were clobbered.
Here’s how we ended up:
Domestic TTI: -0.77% (last close -0.13%)—Sell signal effective 11/13/2015
International TTI: -4.45% (last close -4.18%)—Sell signal effective 8/21/2015
Disclosure: I am obliged to inform you that I, as well as advisory clients of mine, own some of these listed ETFs. Furthermore, they do not represent a specific investment recommendation for you, they merely show which ETFs from the universe I track are falling within the guidelines specified.
Contact Ulli