
- Moving the market
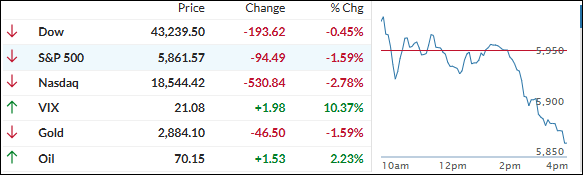
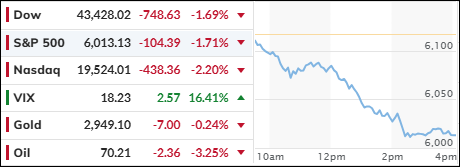
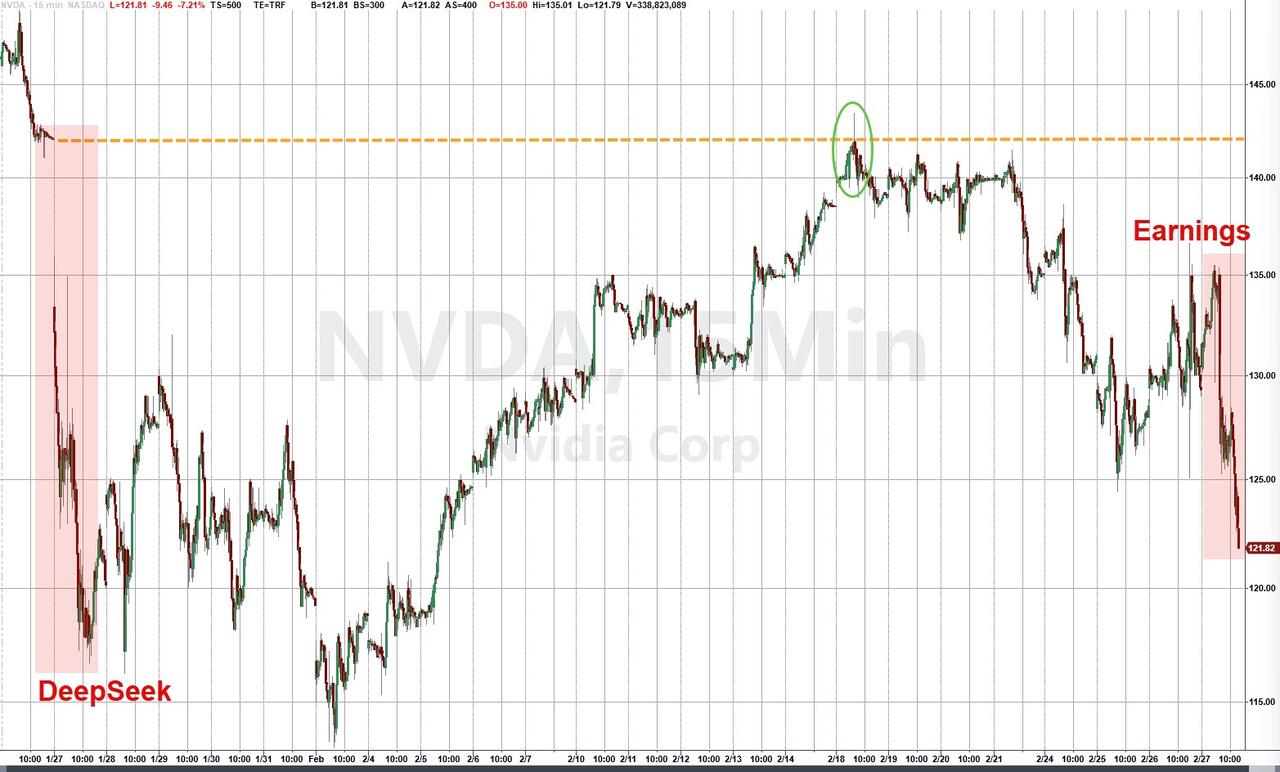
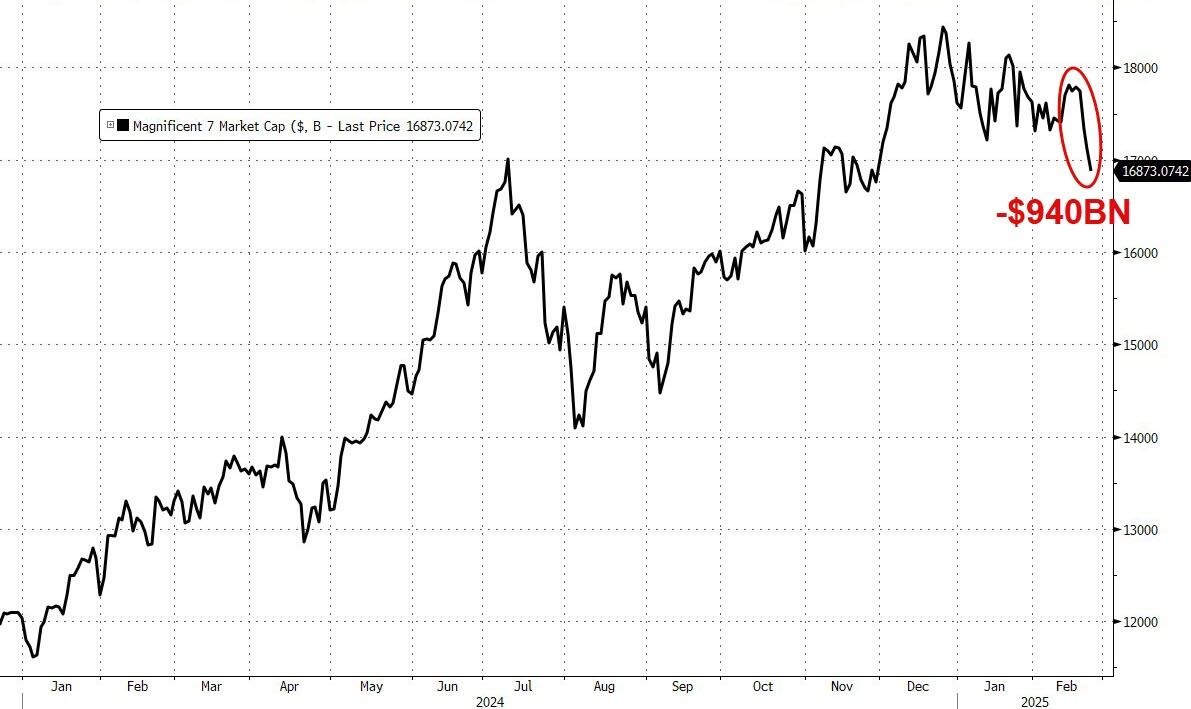
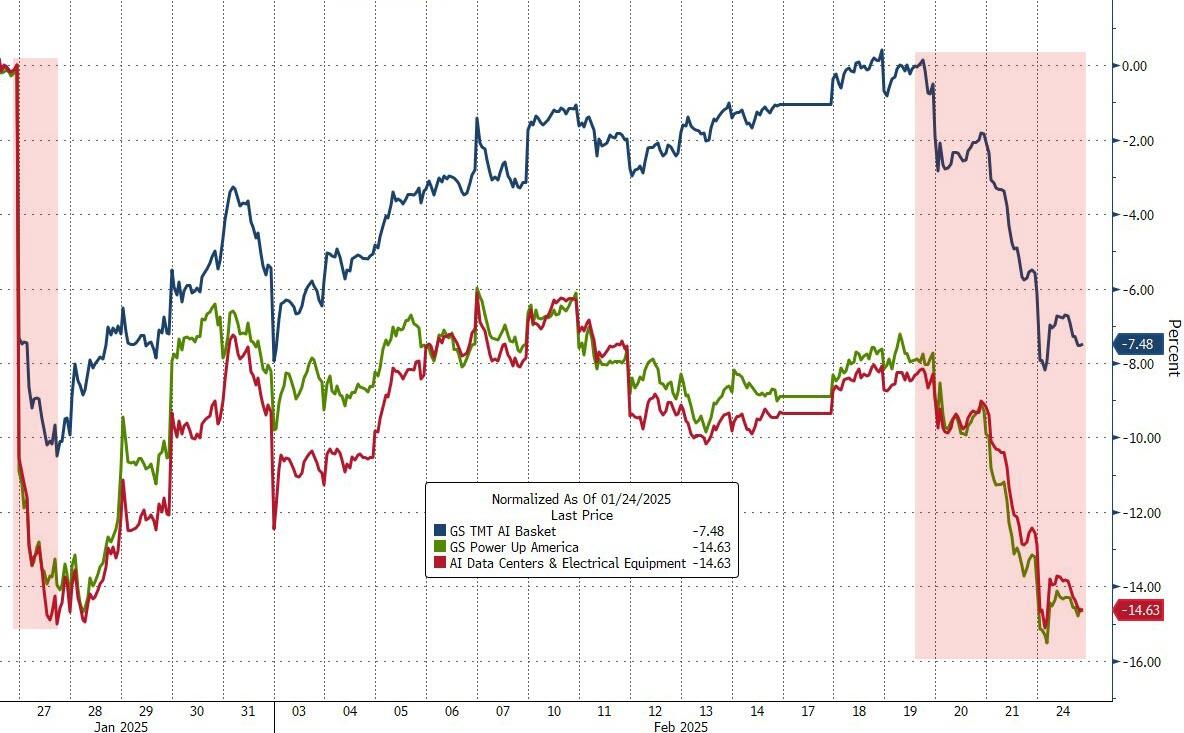
Despite Nvidia exceeding fourth-quarter estimates and providing strong AI guidance, mixed aspects of their earnings report led to an 8.5% drop in the stock. Major indexes followed suit, closing another session in the red.
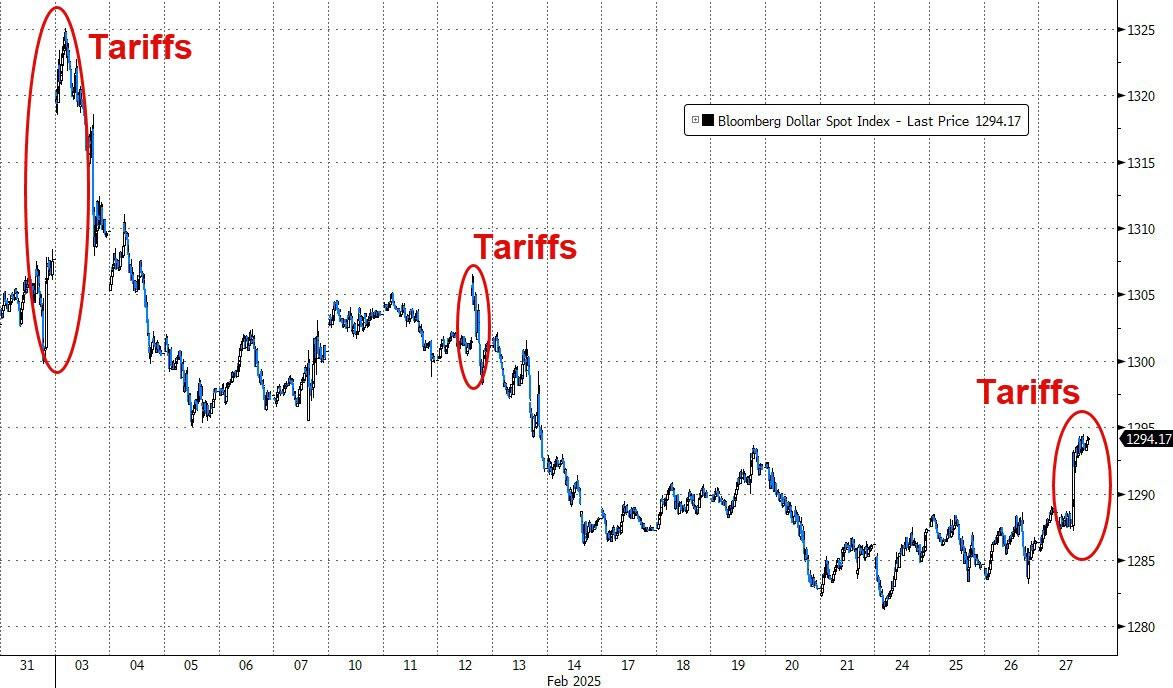
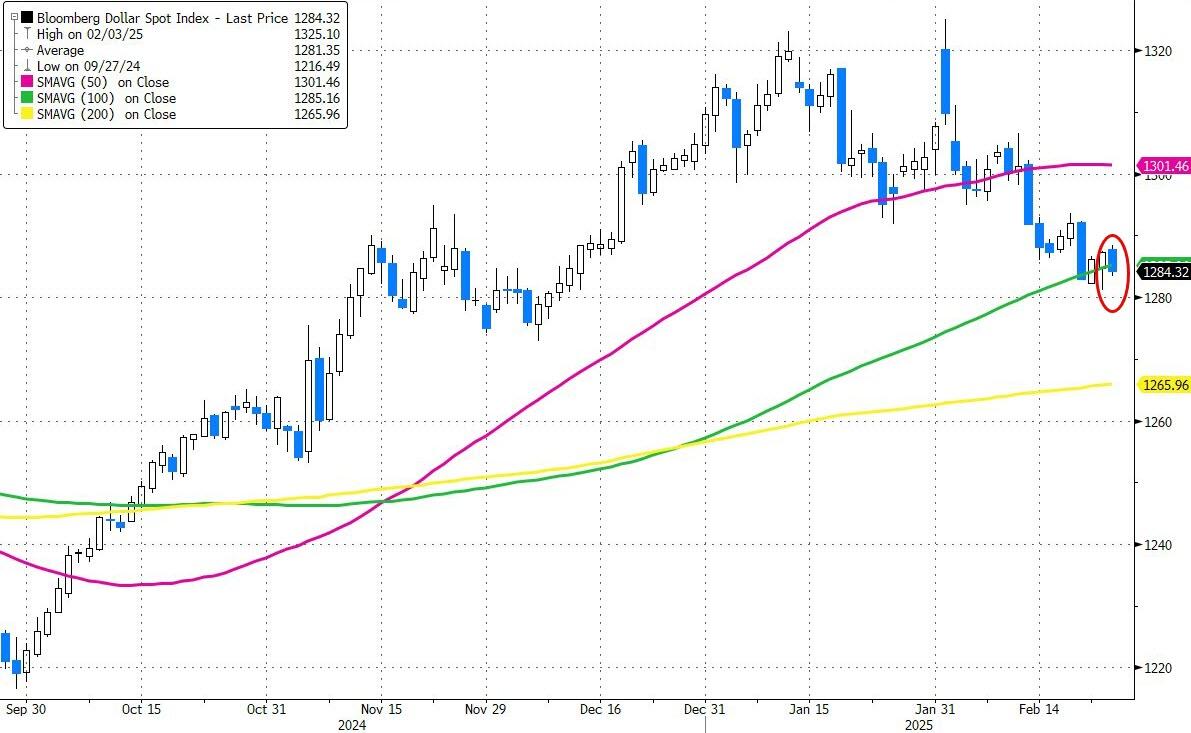
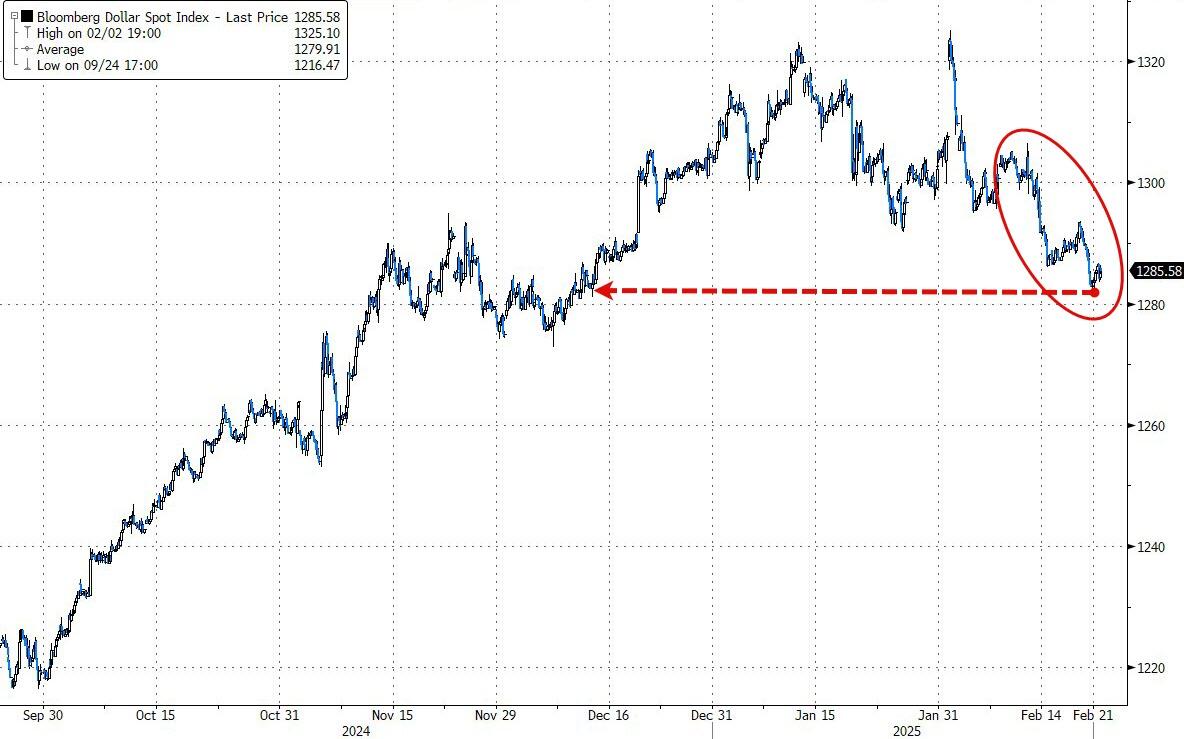
Adding to the market’s woes, Trump’s announcement that tariffs on Mexico and Canada would proceed as planned, effective March 4th after a one-month moratorium, caused only the dollar to gain.
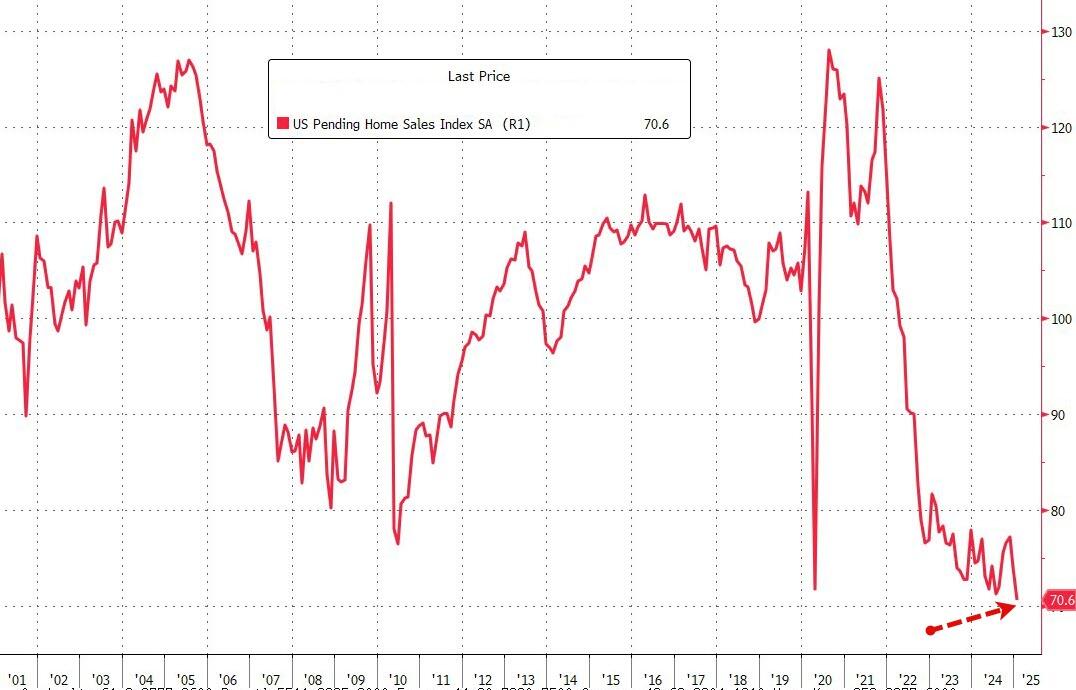
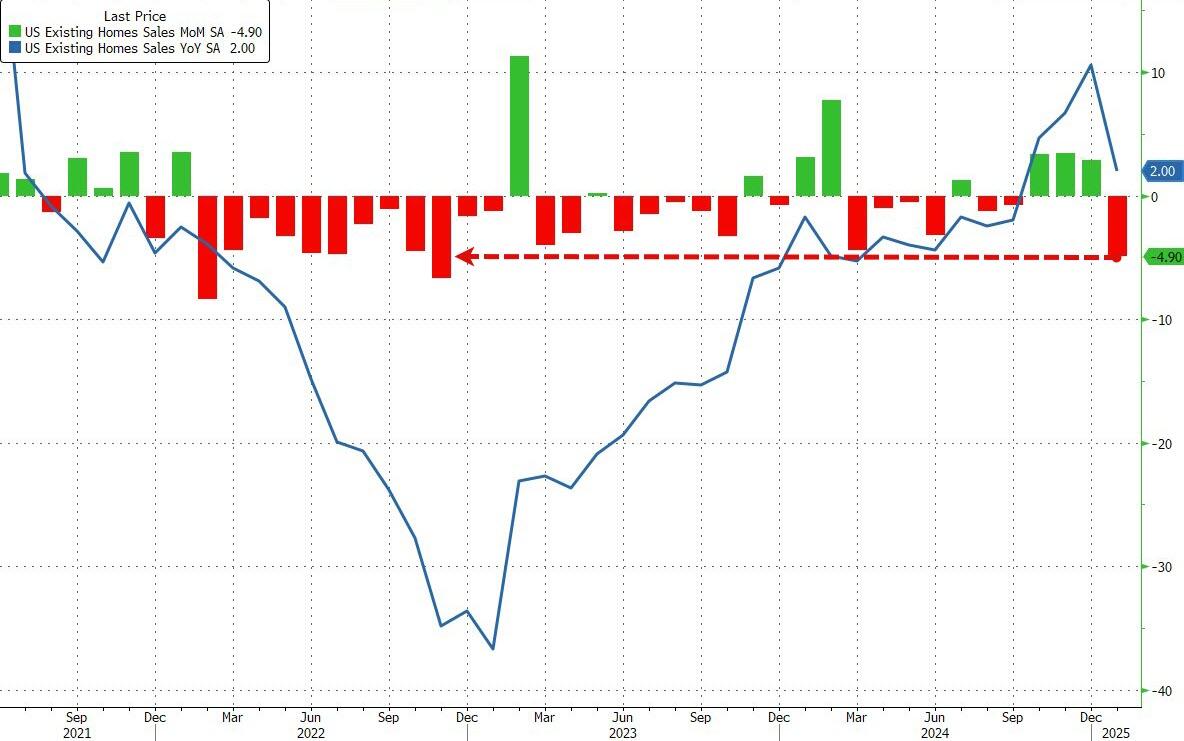
A rise in jobless claims to 242,000, higher than the estimated 225,000, further dampened market sentiment. Additionally, a collapse in Pending Home Sales to all-time lows failed to encourage dip buyers to push equities higher.
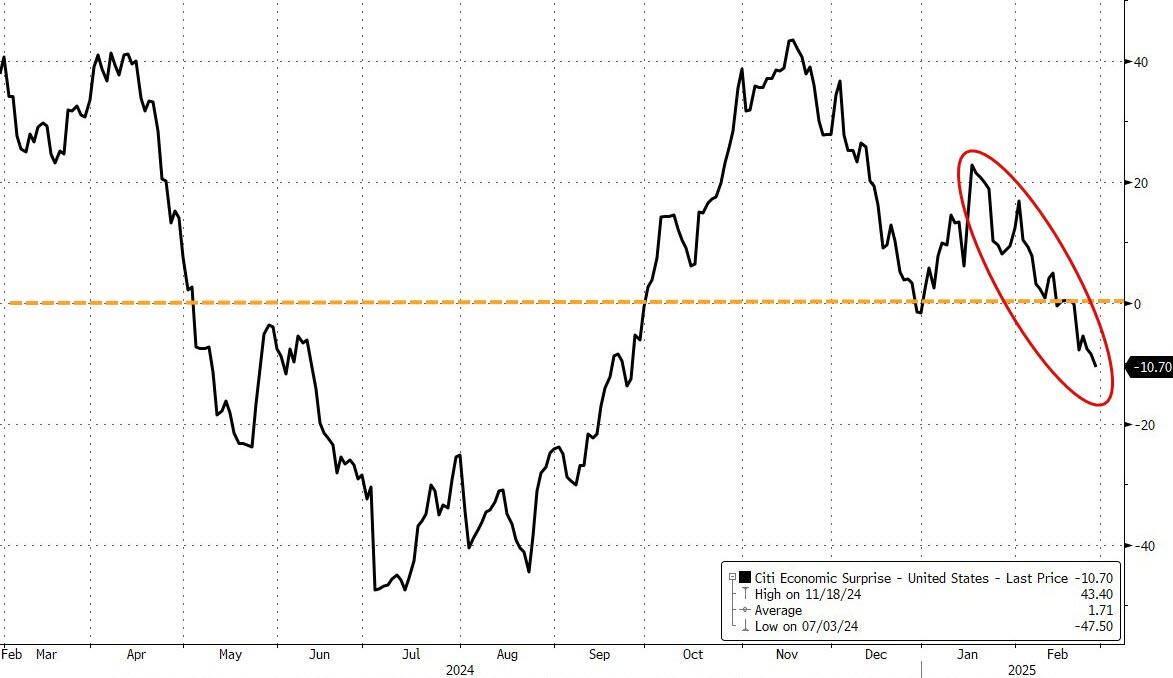
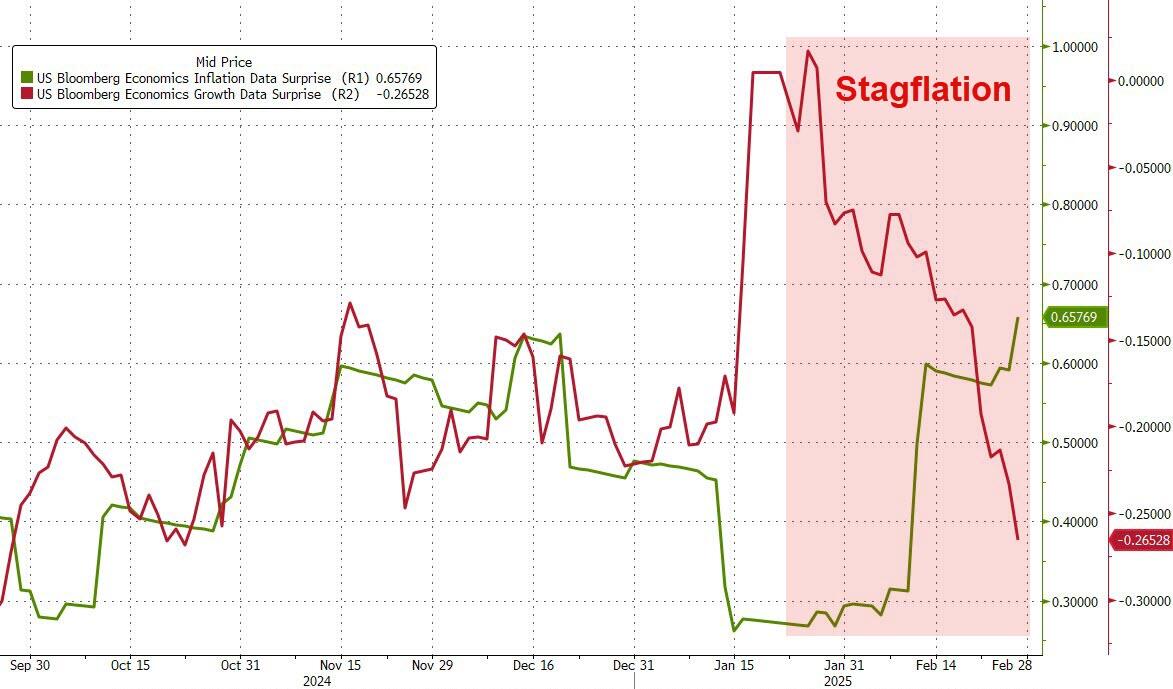
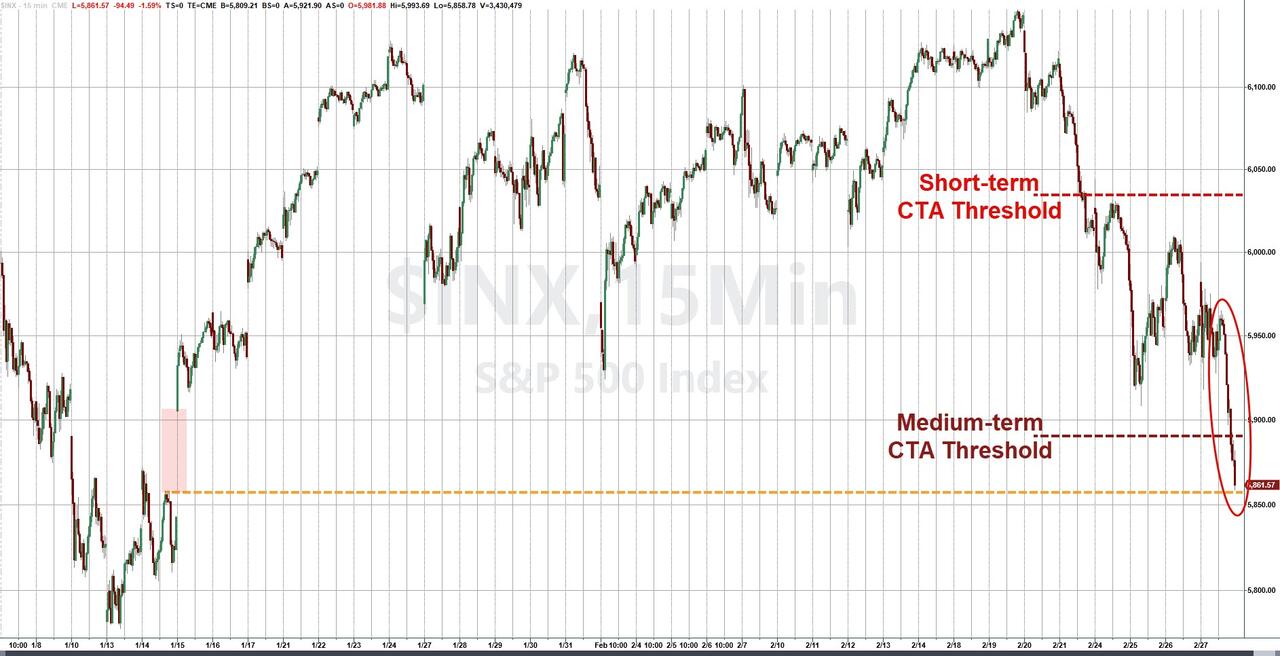
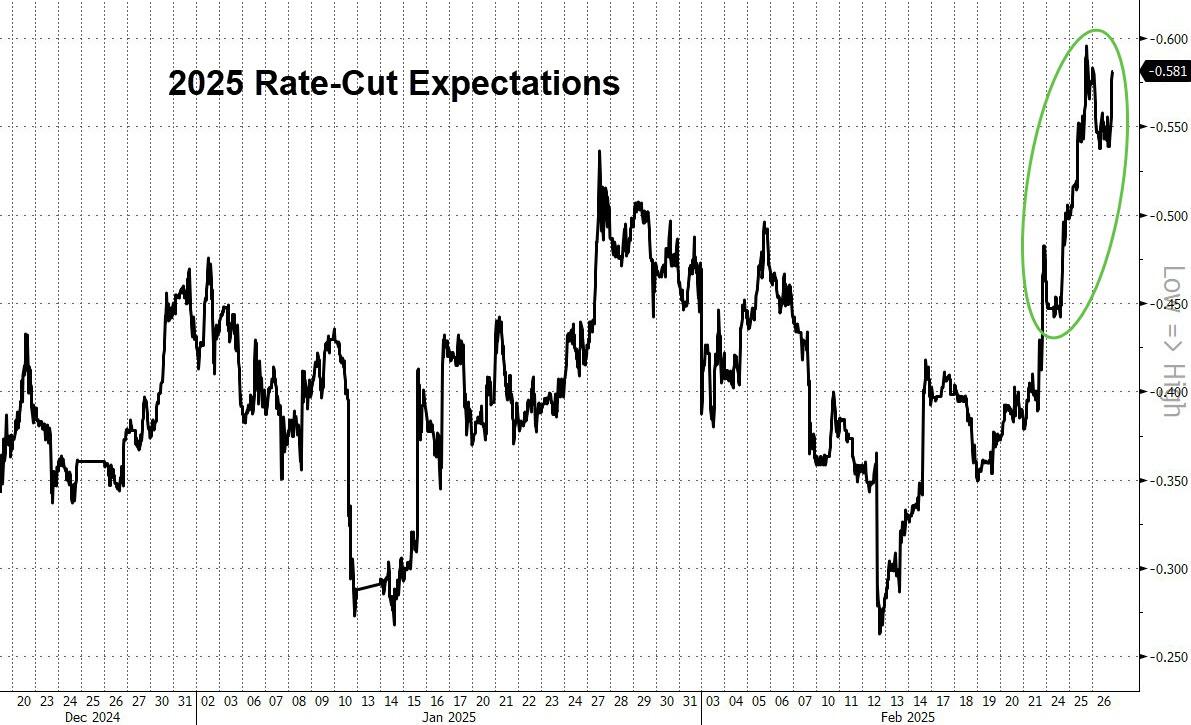
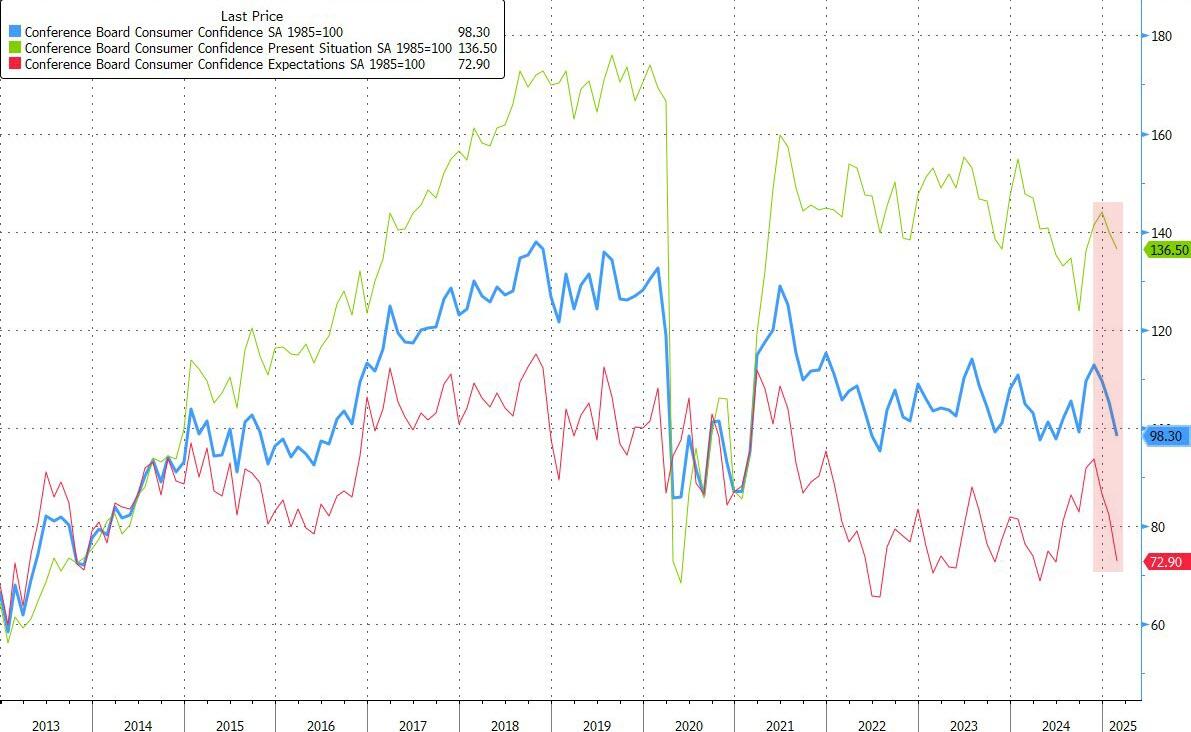
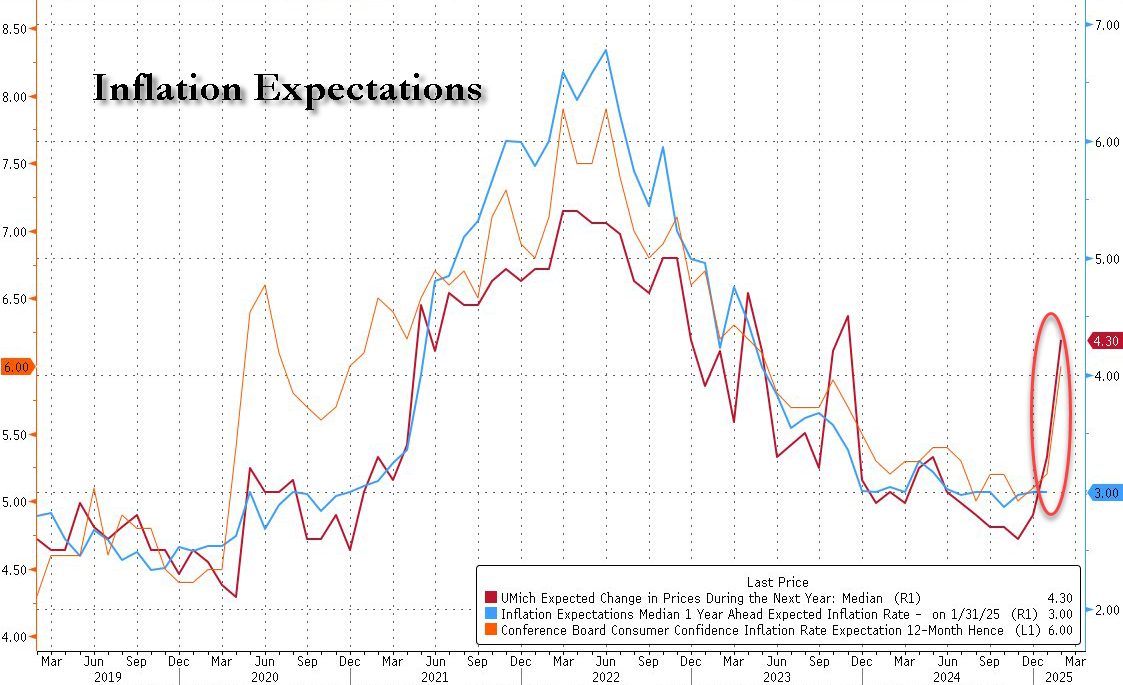
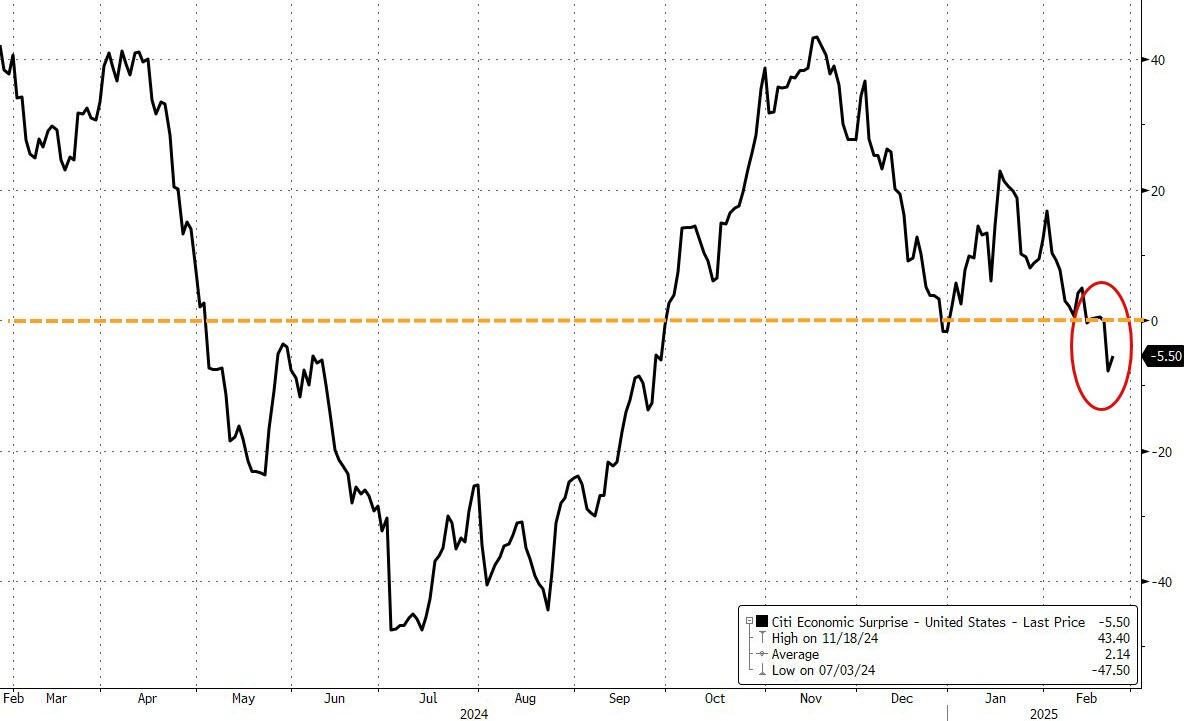
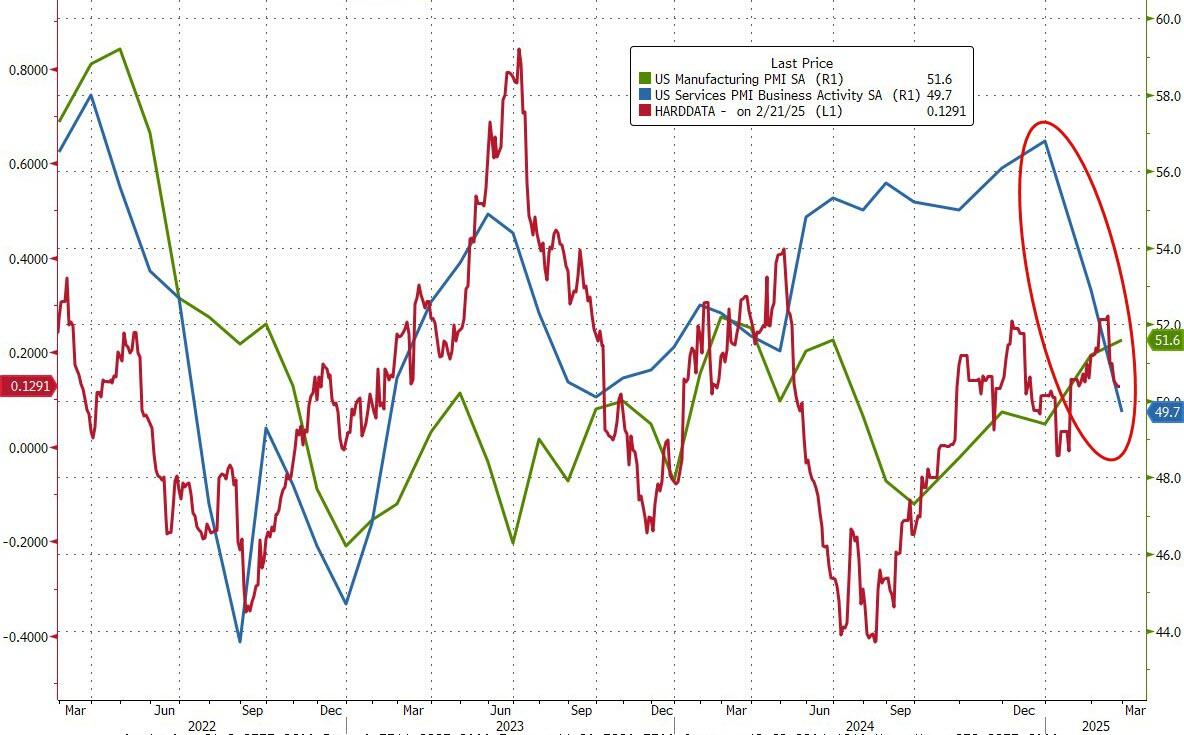
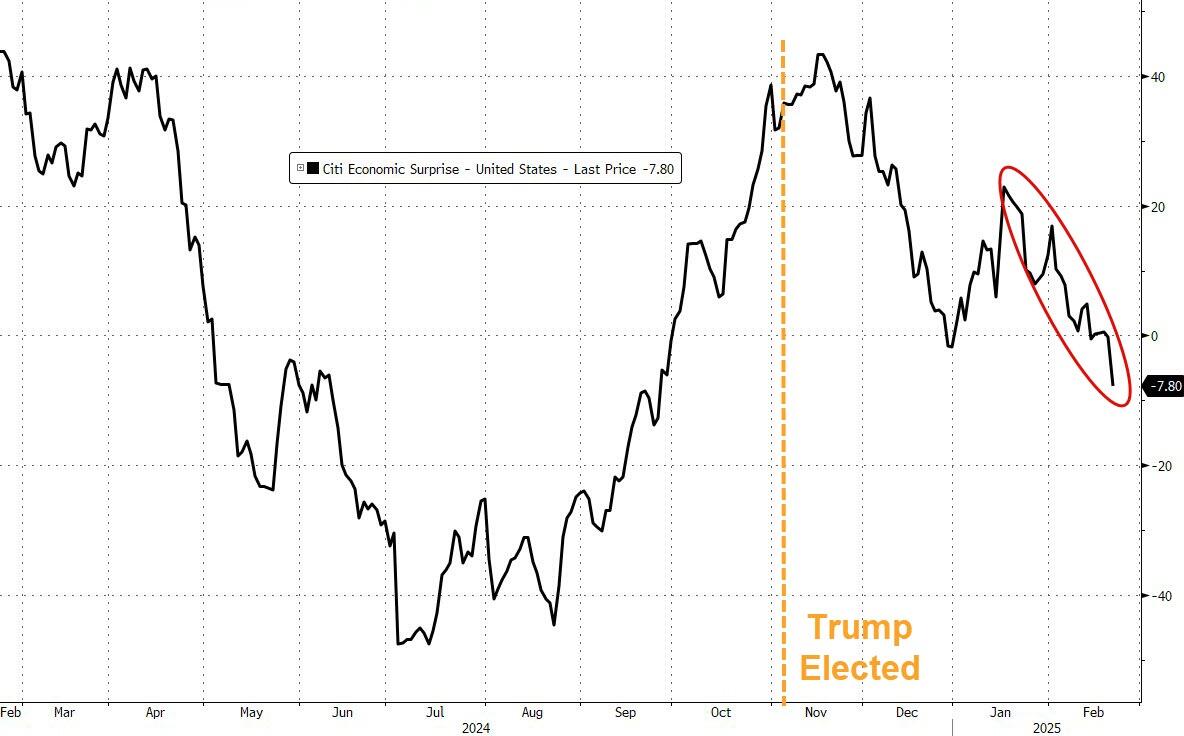
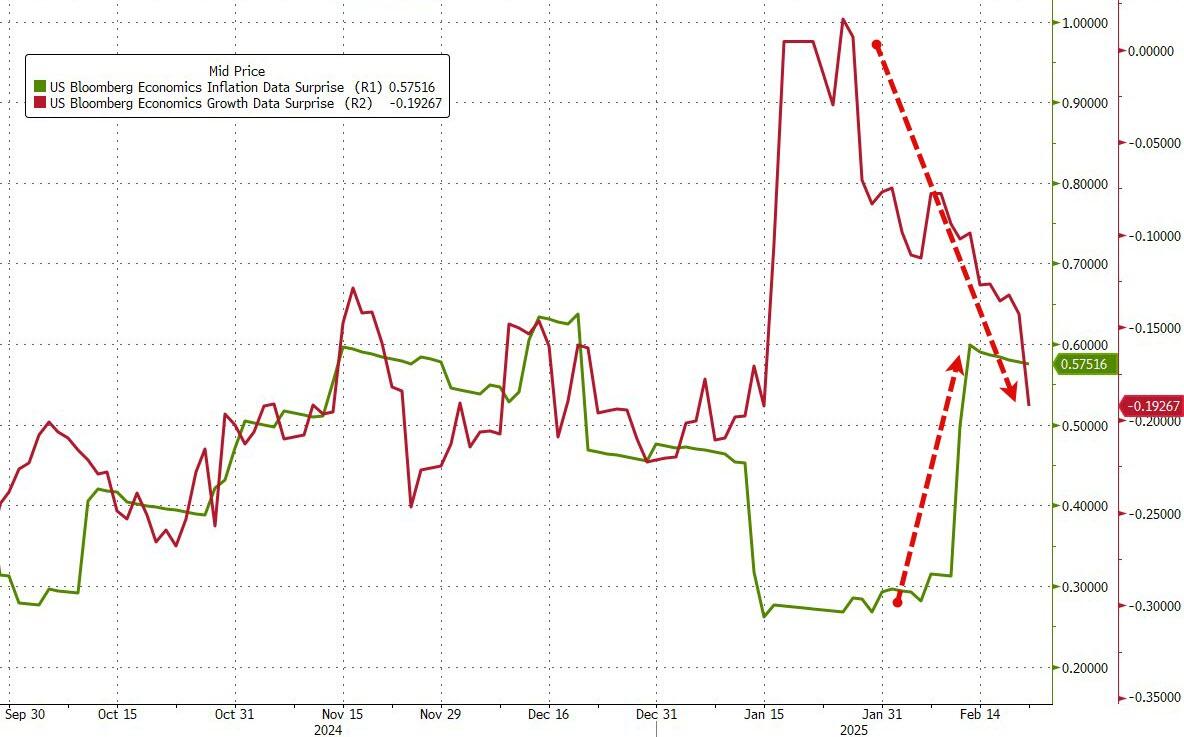
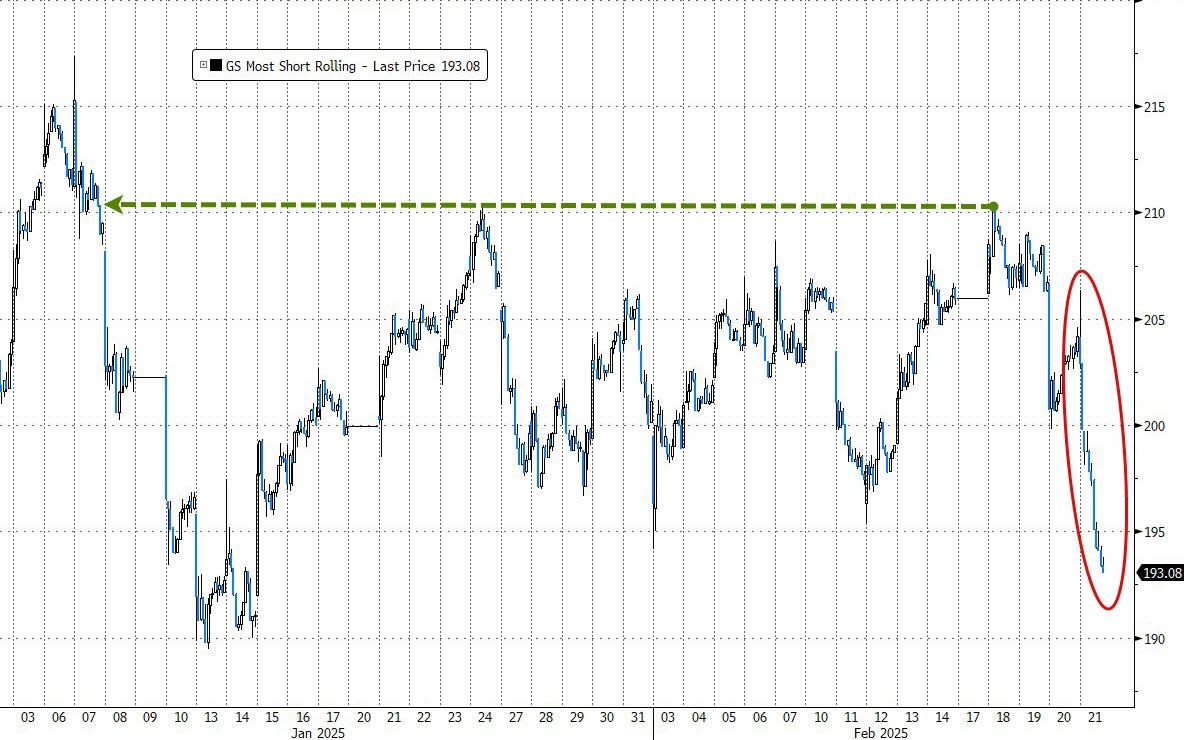
Consequently, the US Macro data index sank deeper, with the threat of “Stagflation” becoming more pronounced. The bullish case is losing momentum, with “big money” positioning to increase sell activity if crucial thresholds are broken.
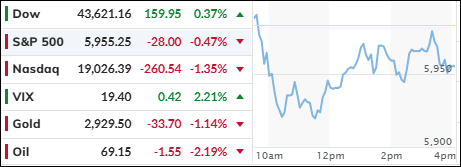
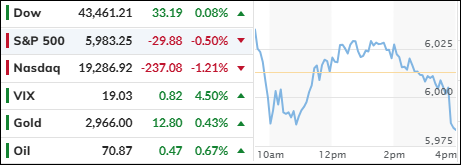
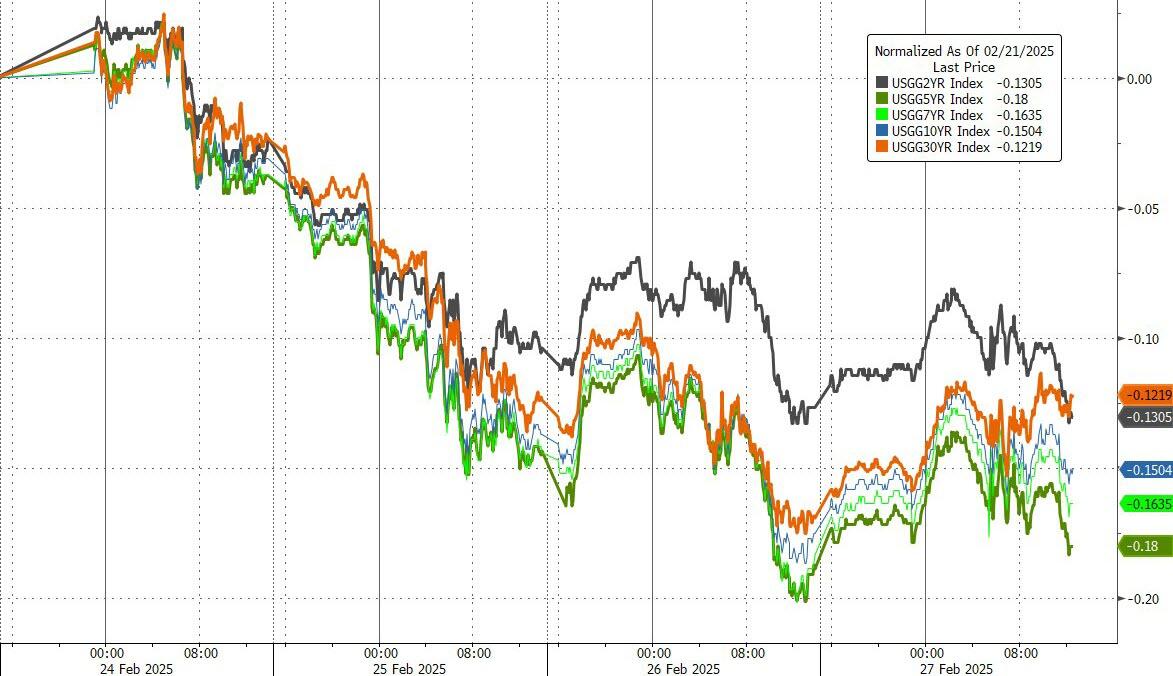
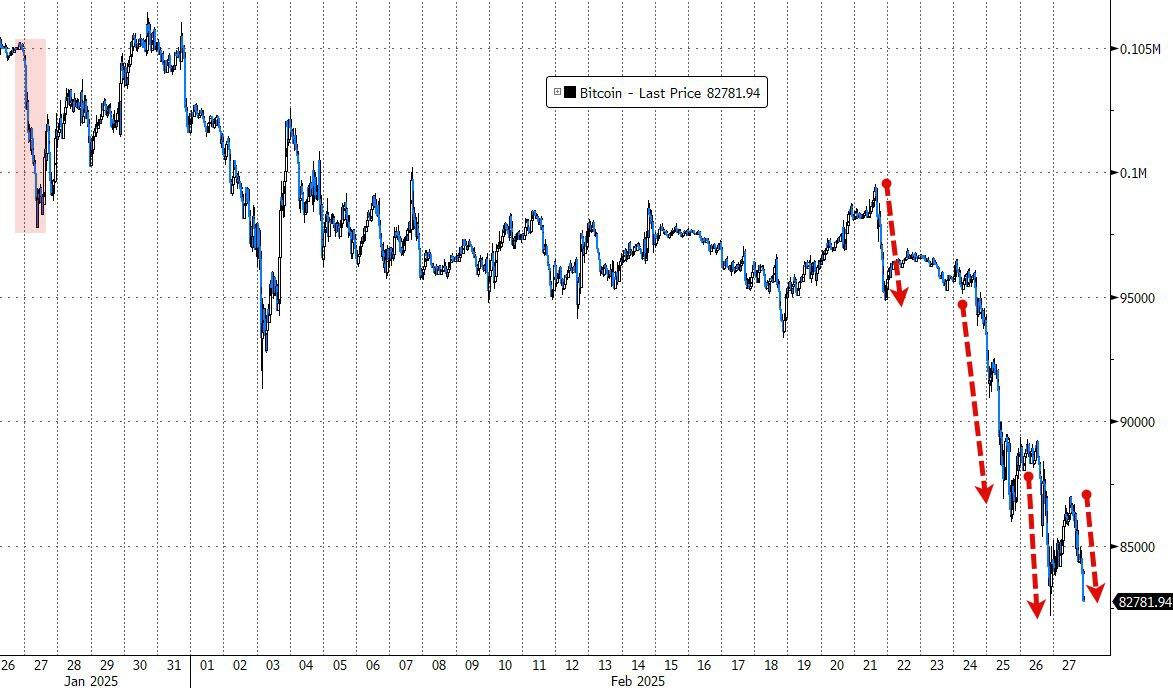
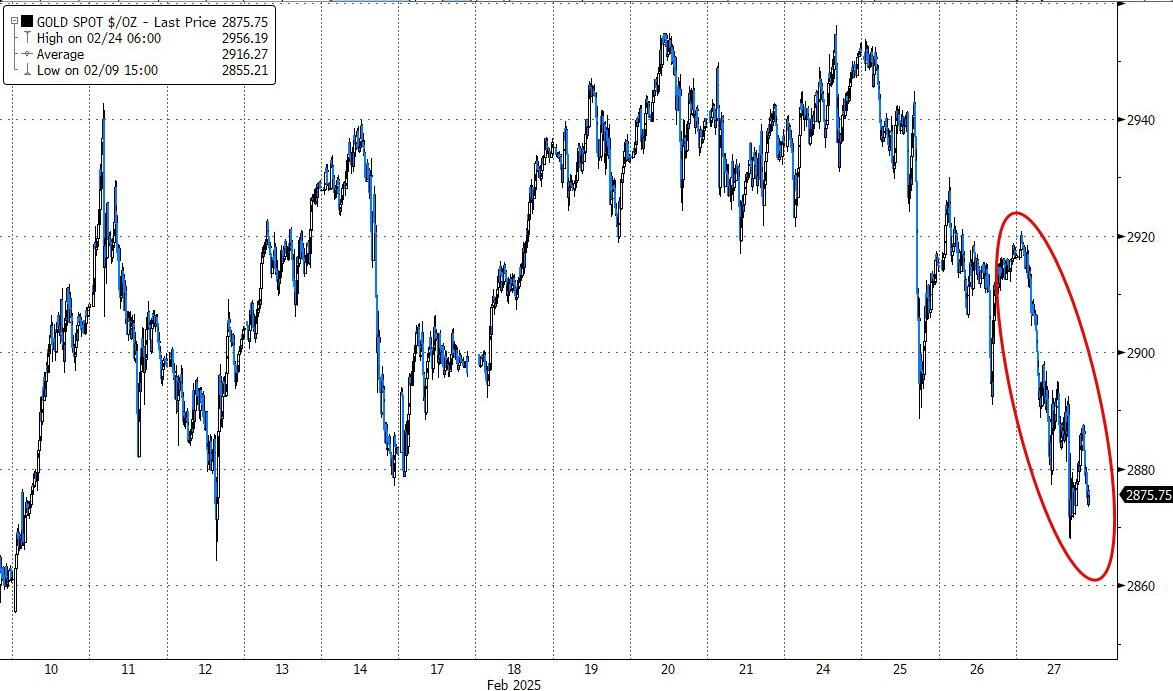
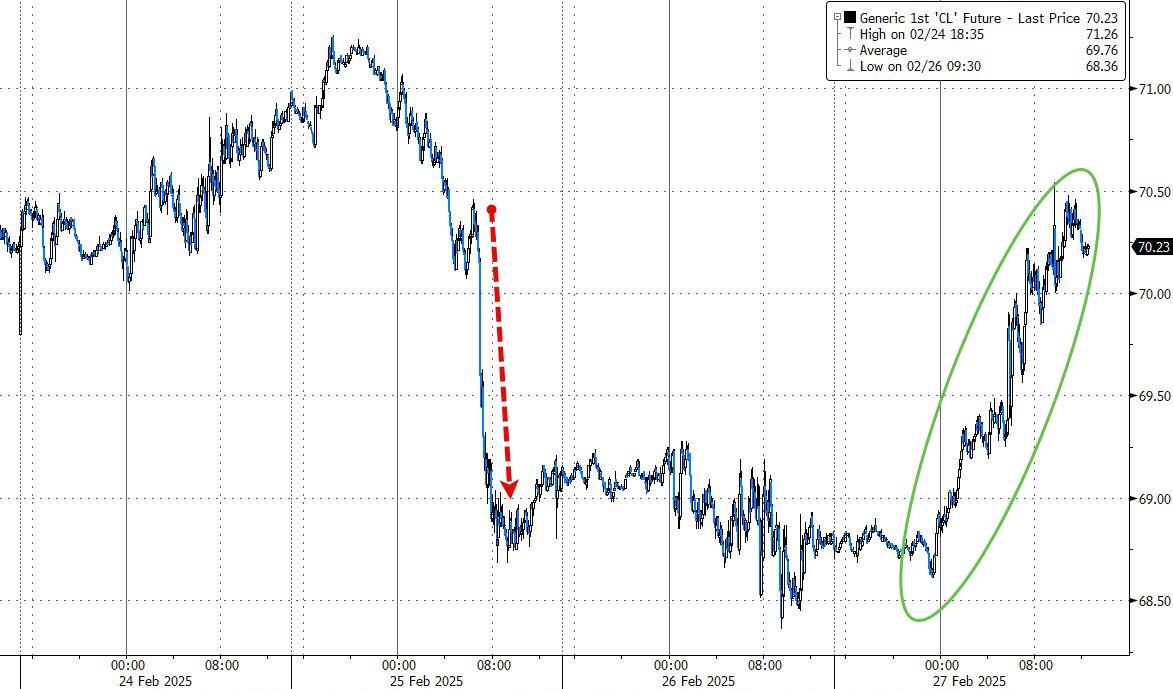
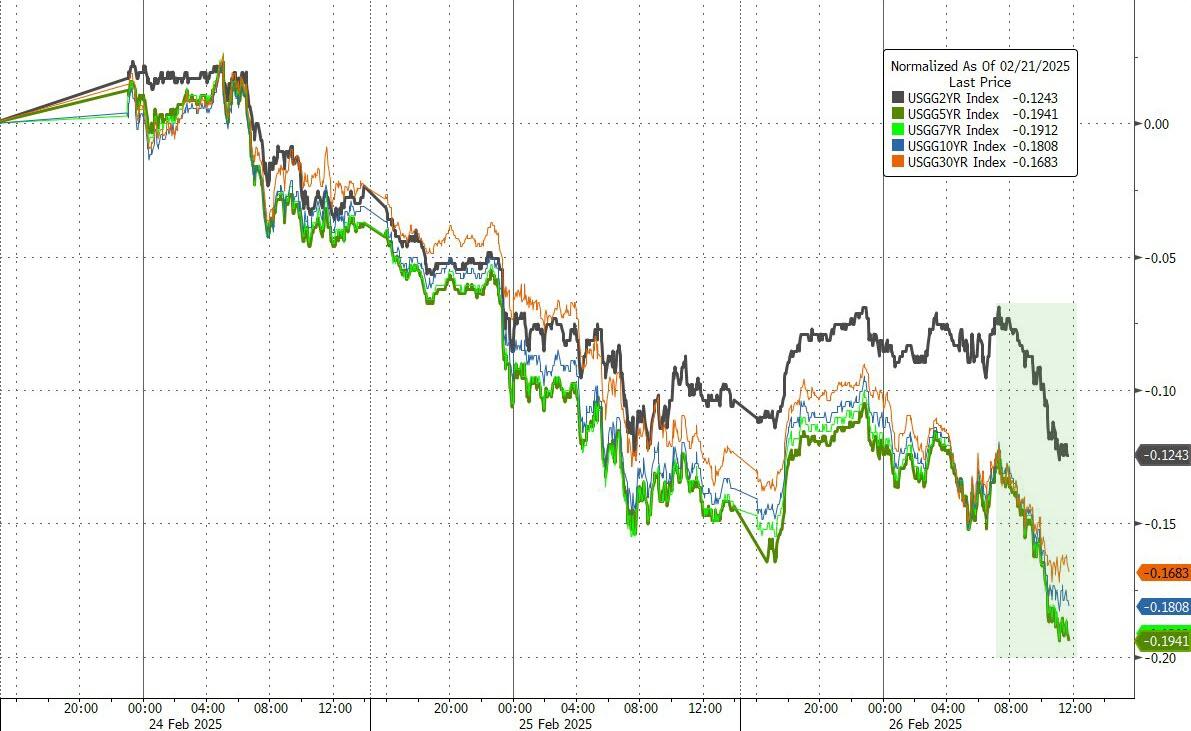
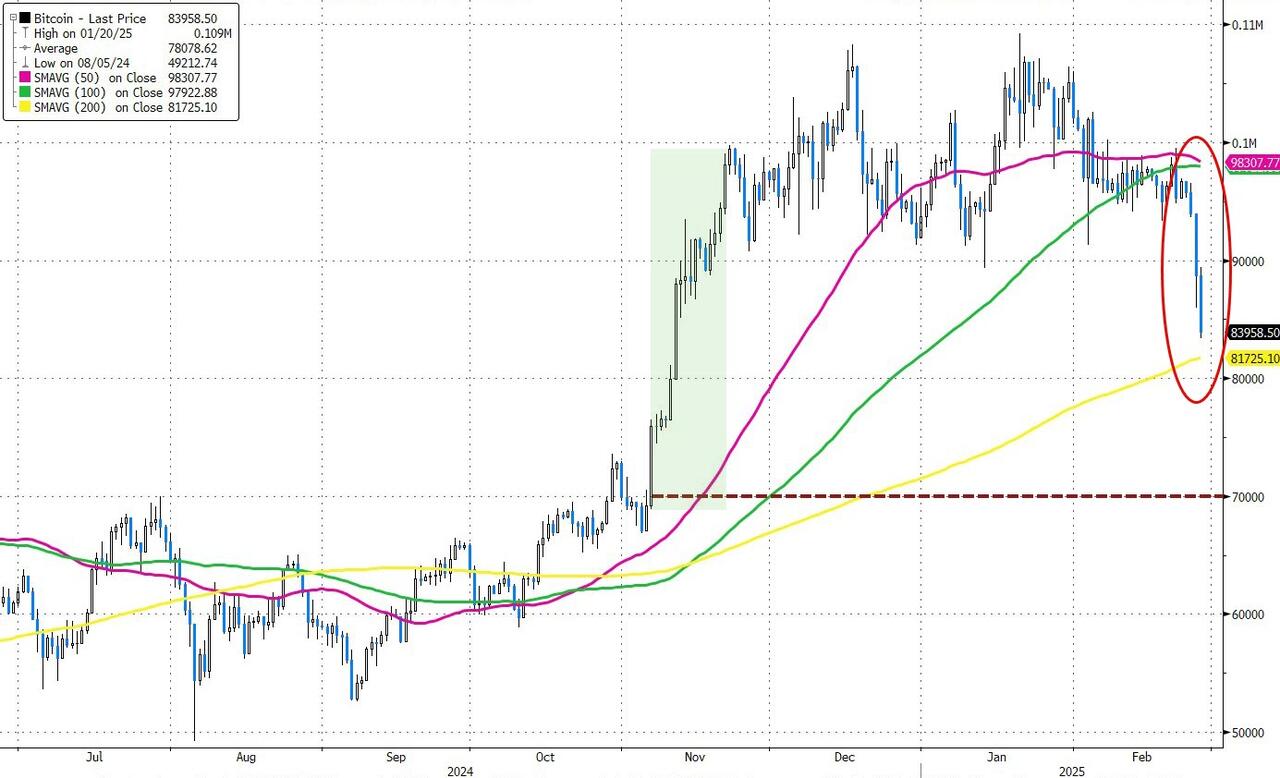
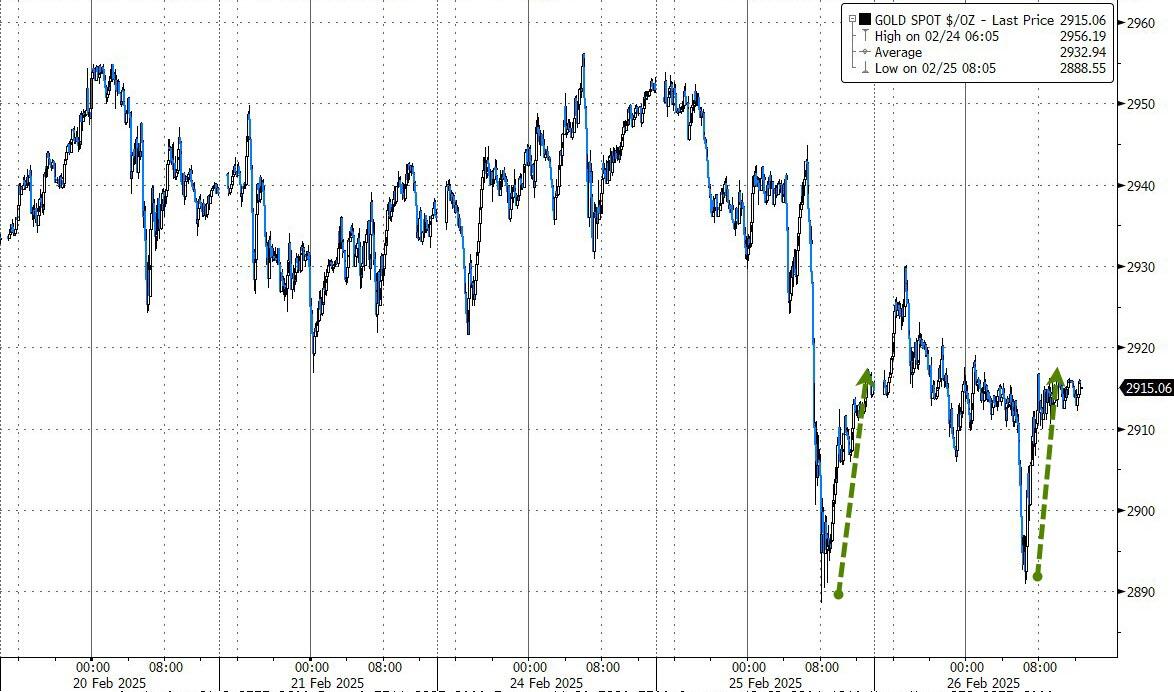
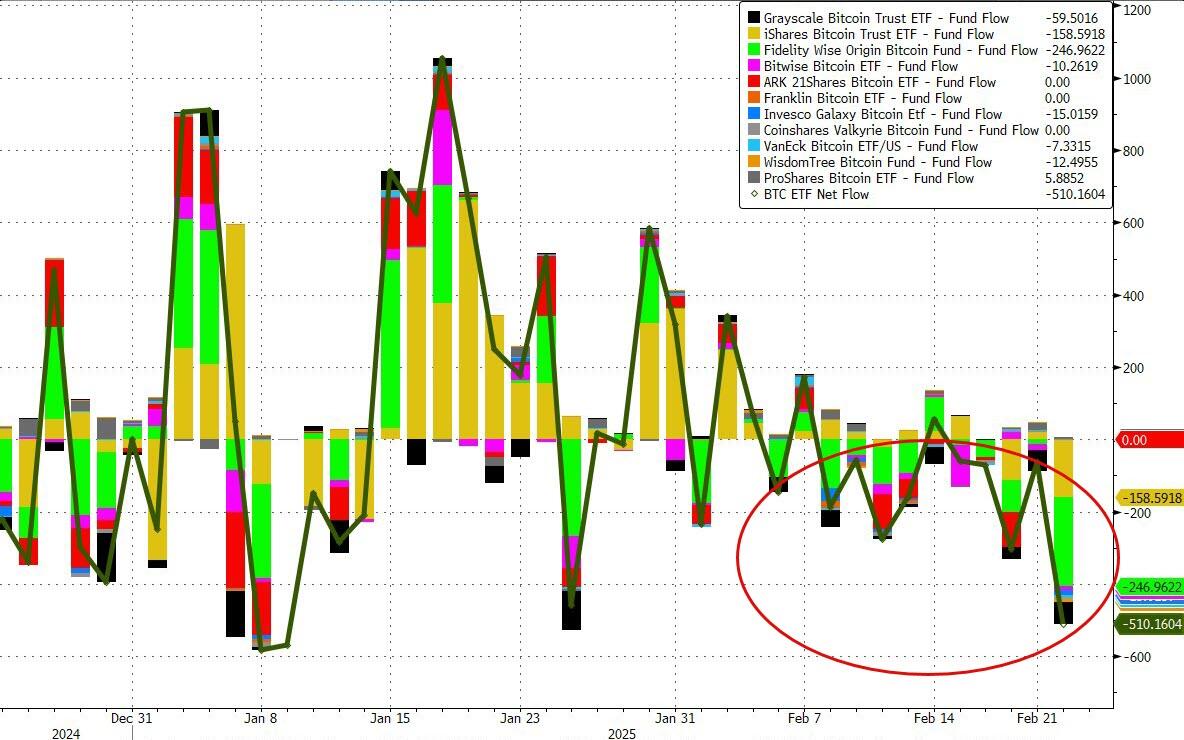
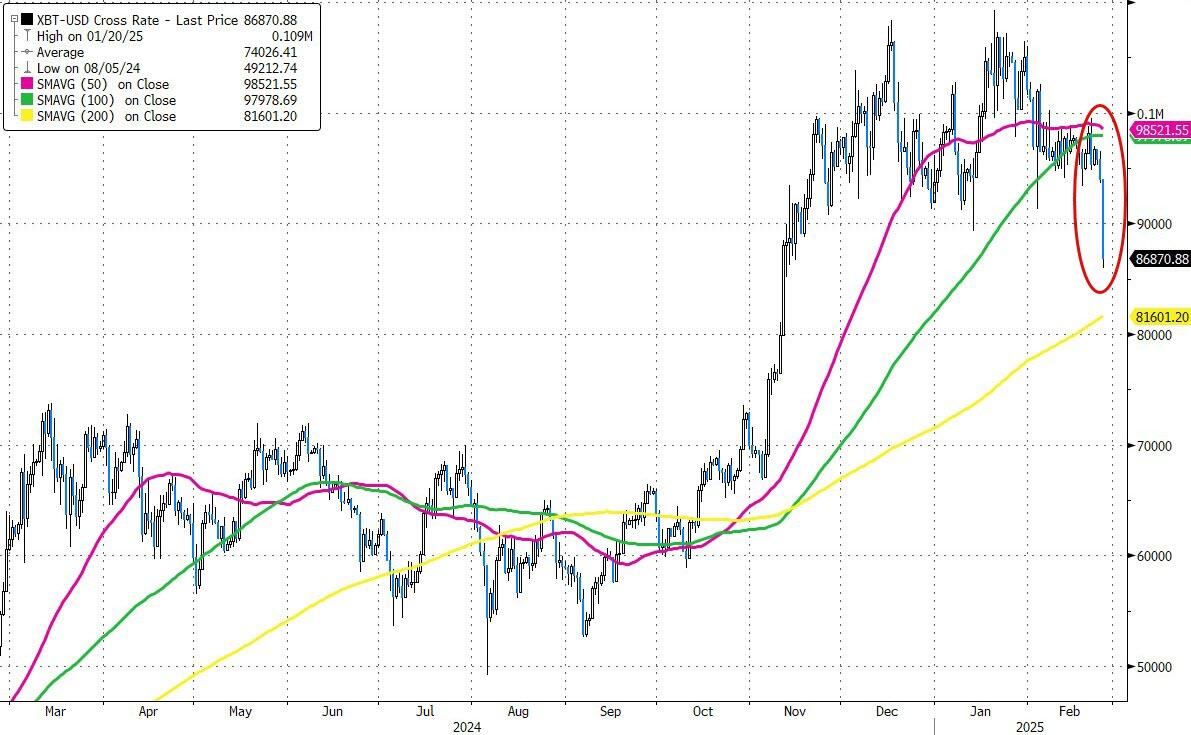
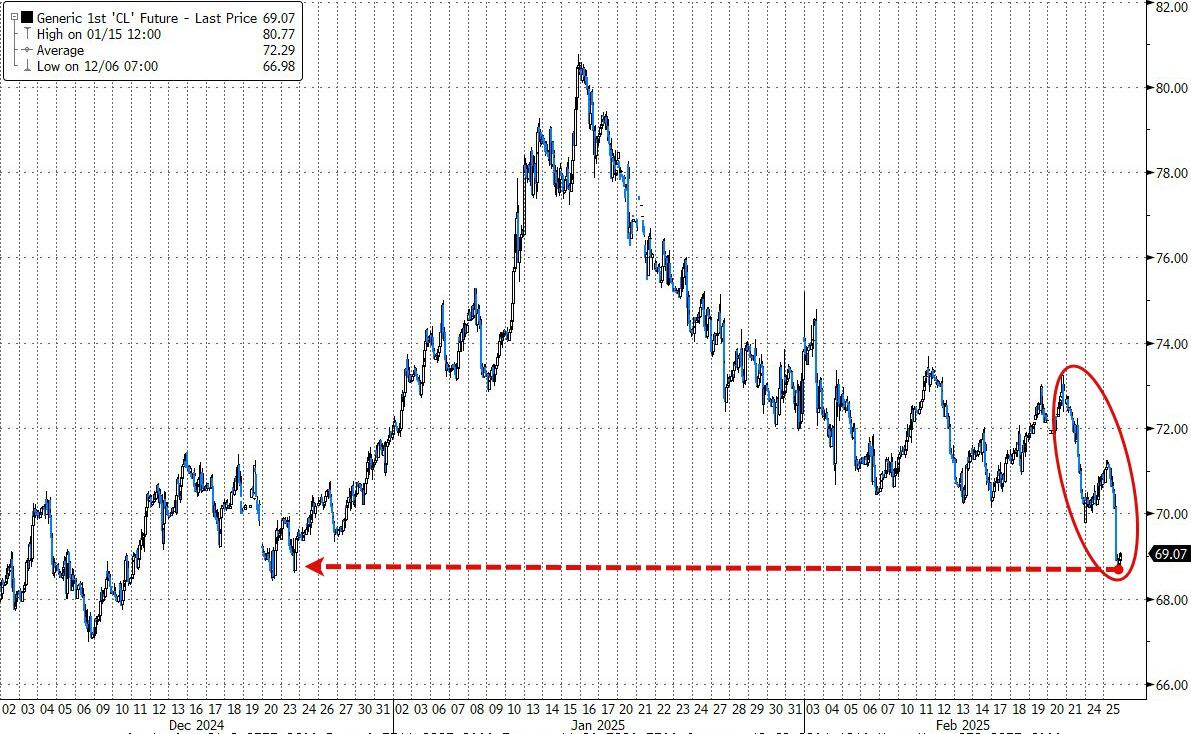
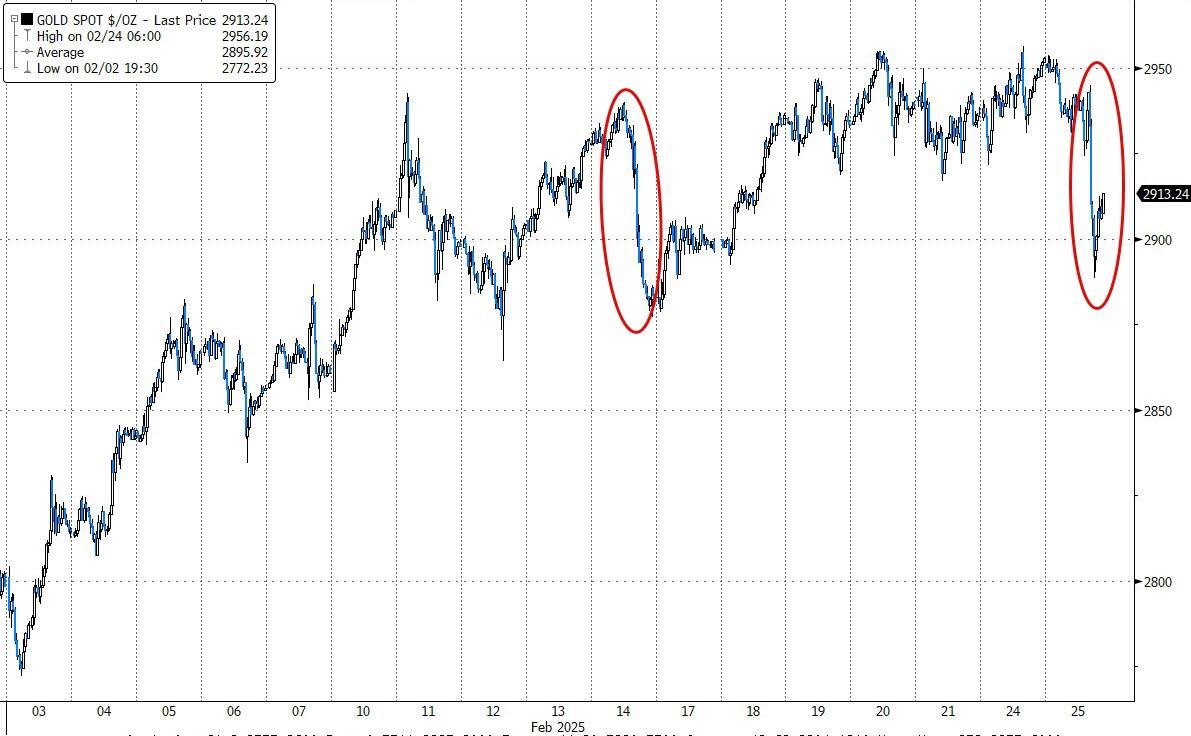
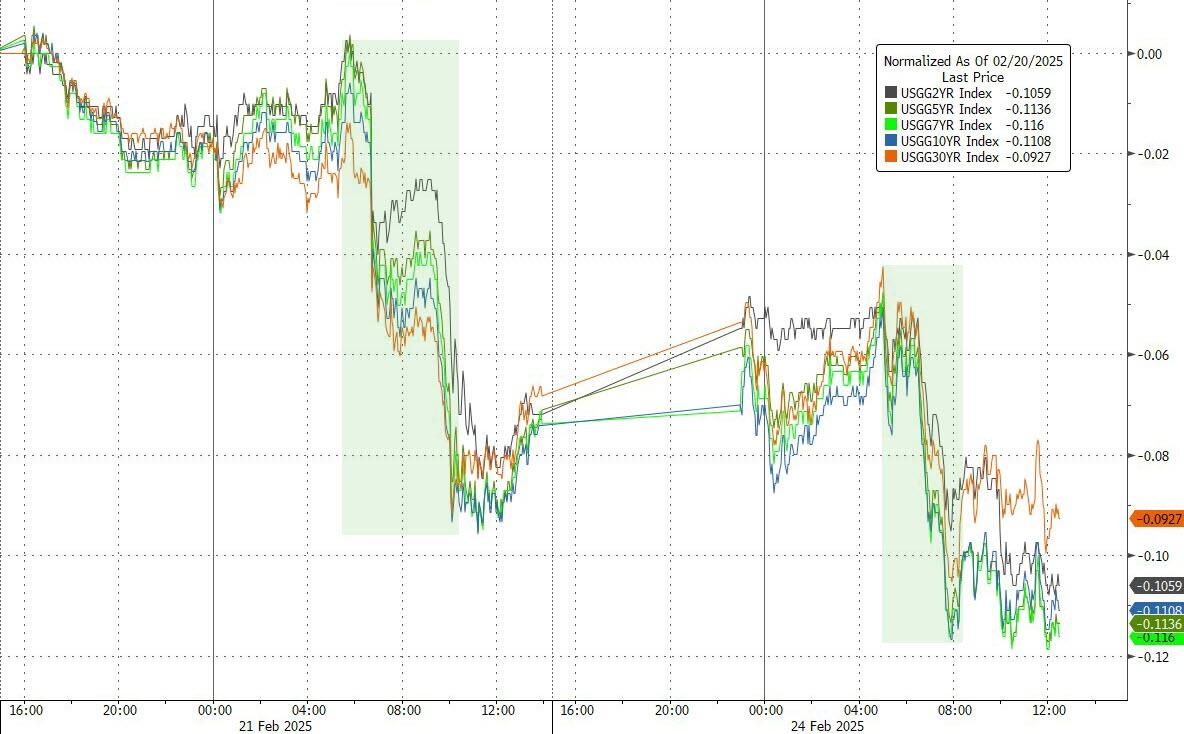
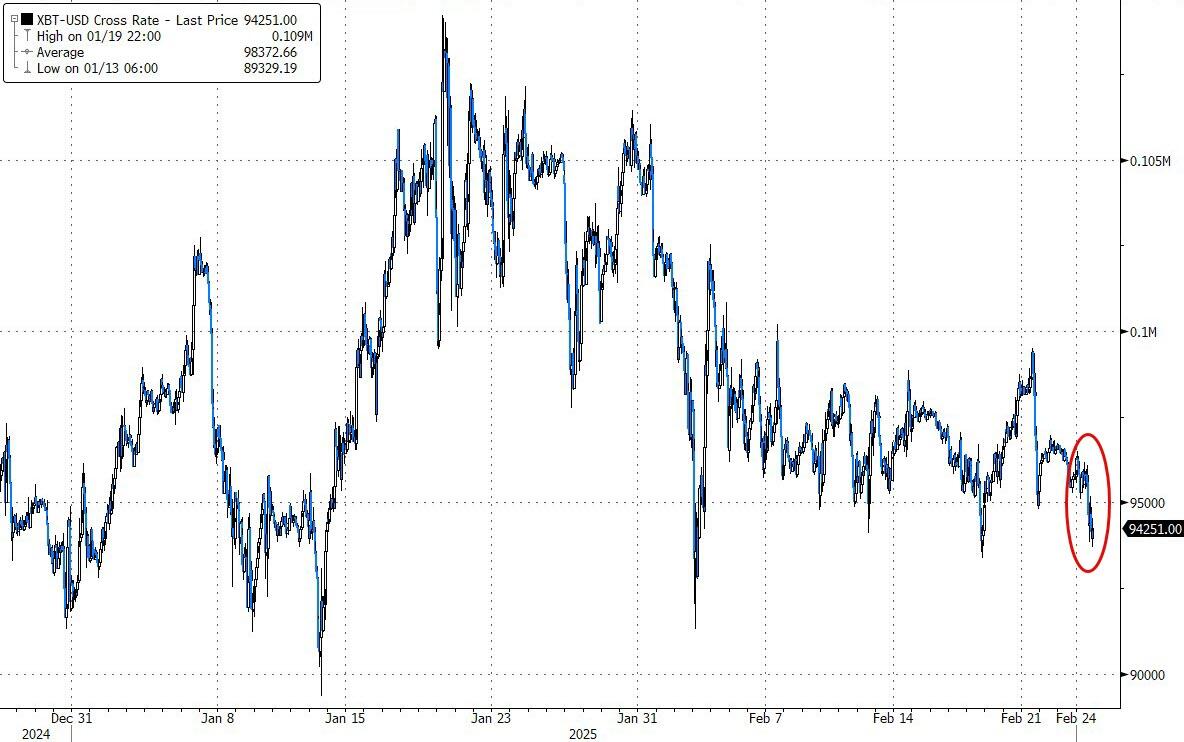
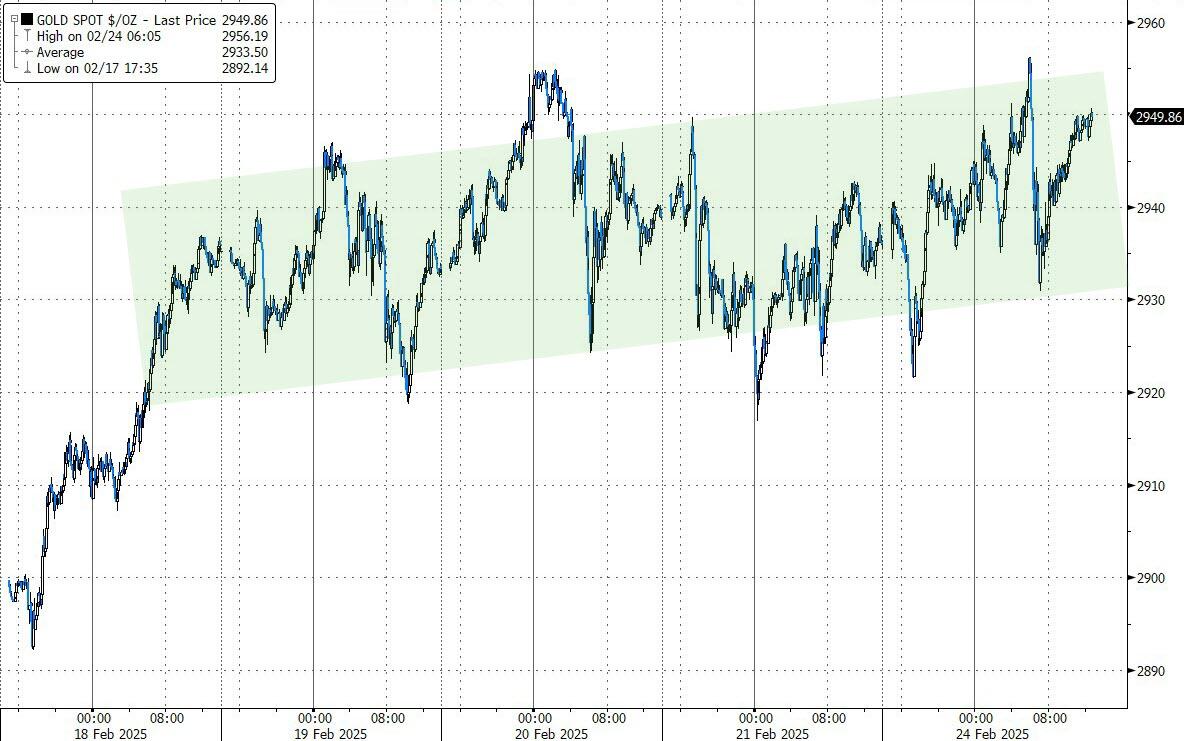
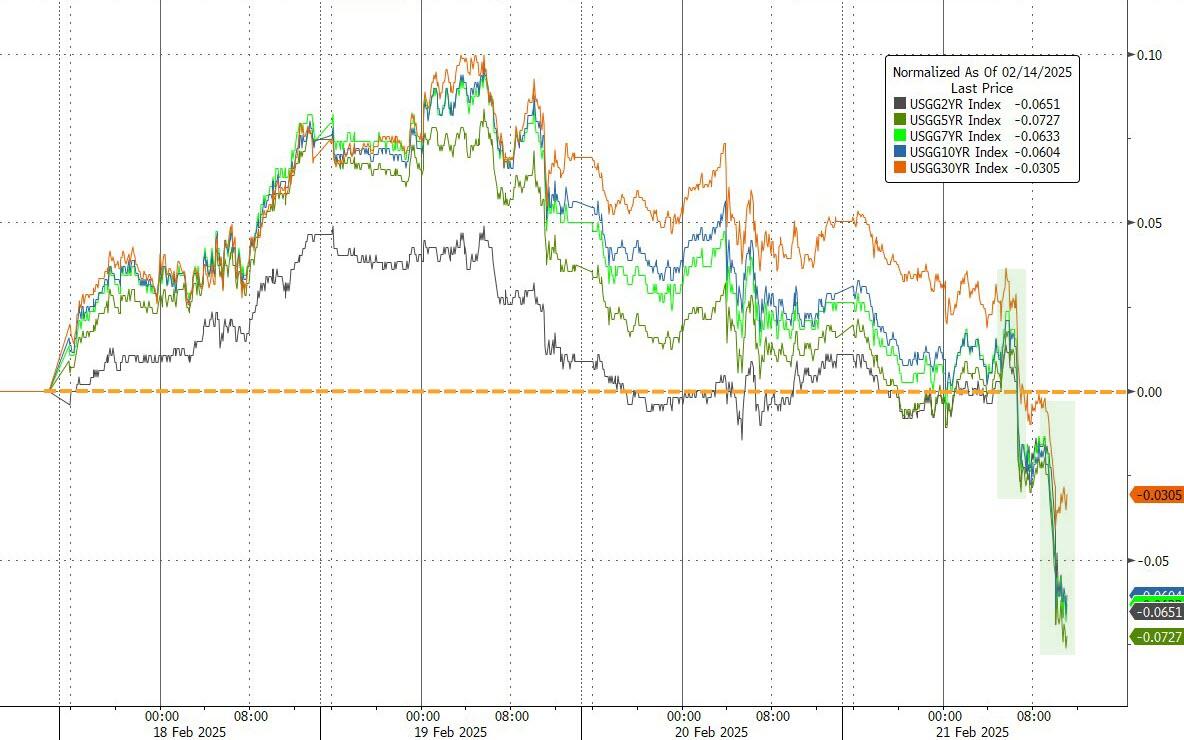
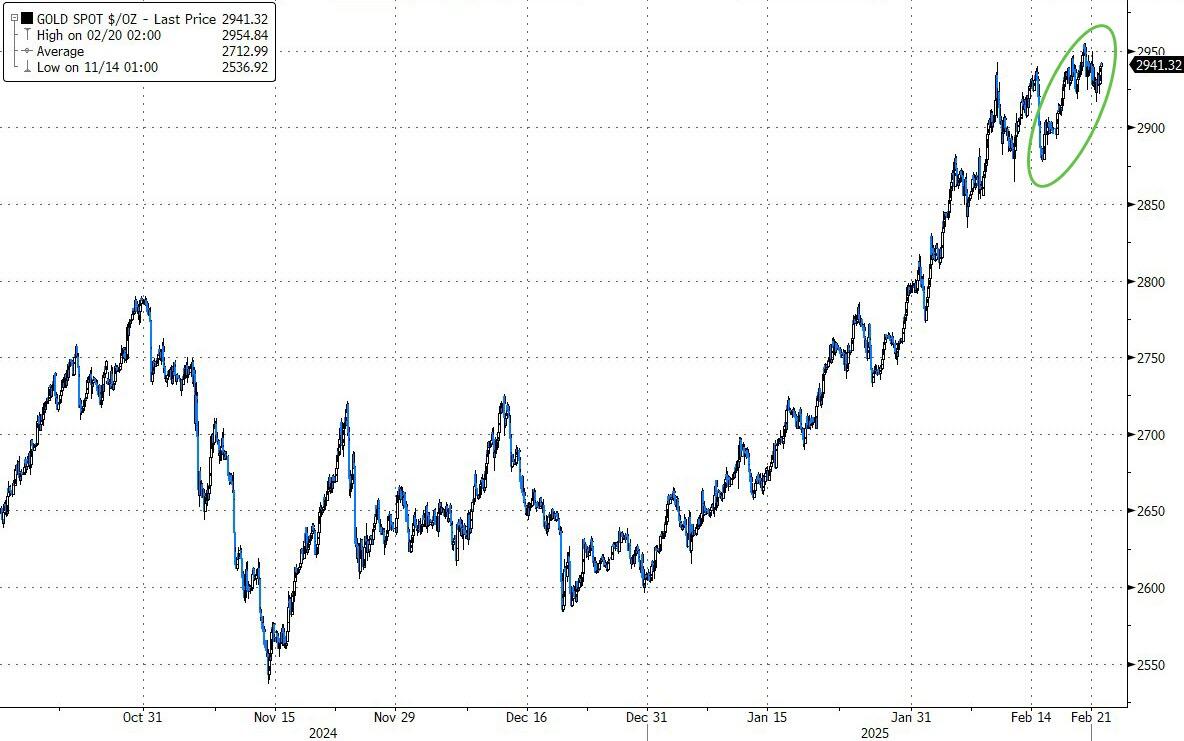
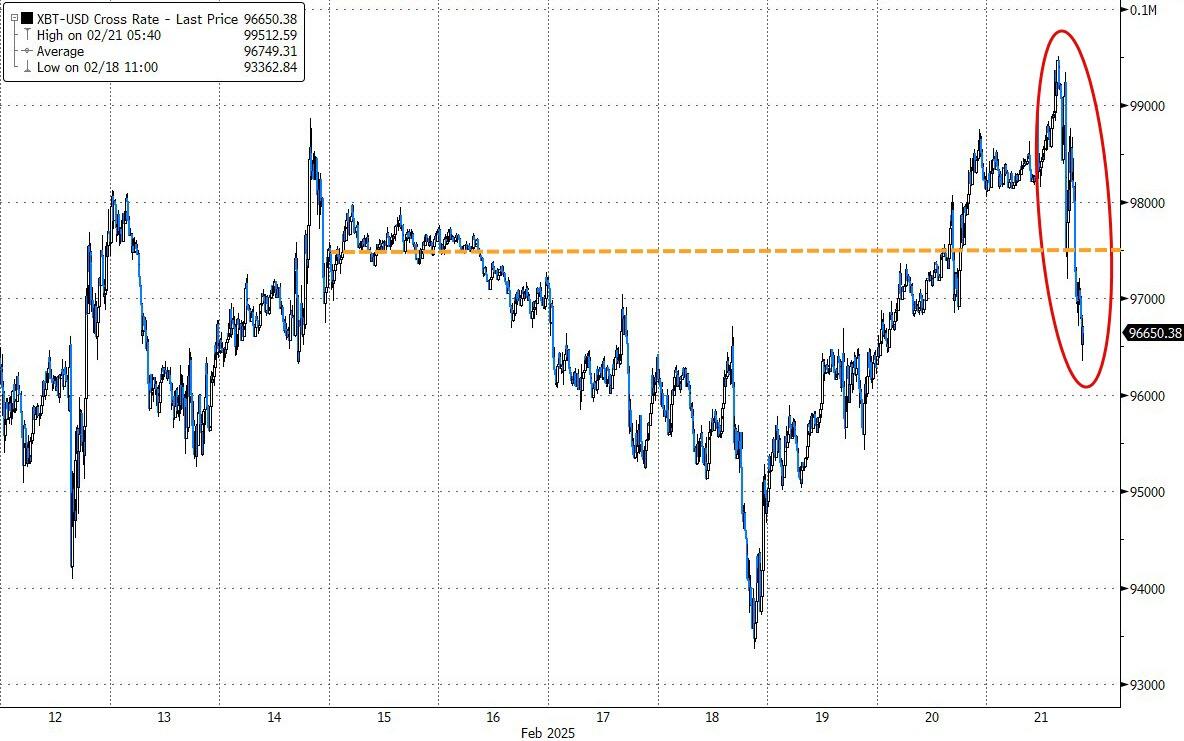
Bond yields were mixed, Bitcoin initially bounced but took another hit late in the session, and gold couldn’t overcome the dollar’s strength, breaking below the $2,900 level. However, crude oil rallied sharply, regaining the $70 marker.
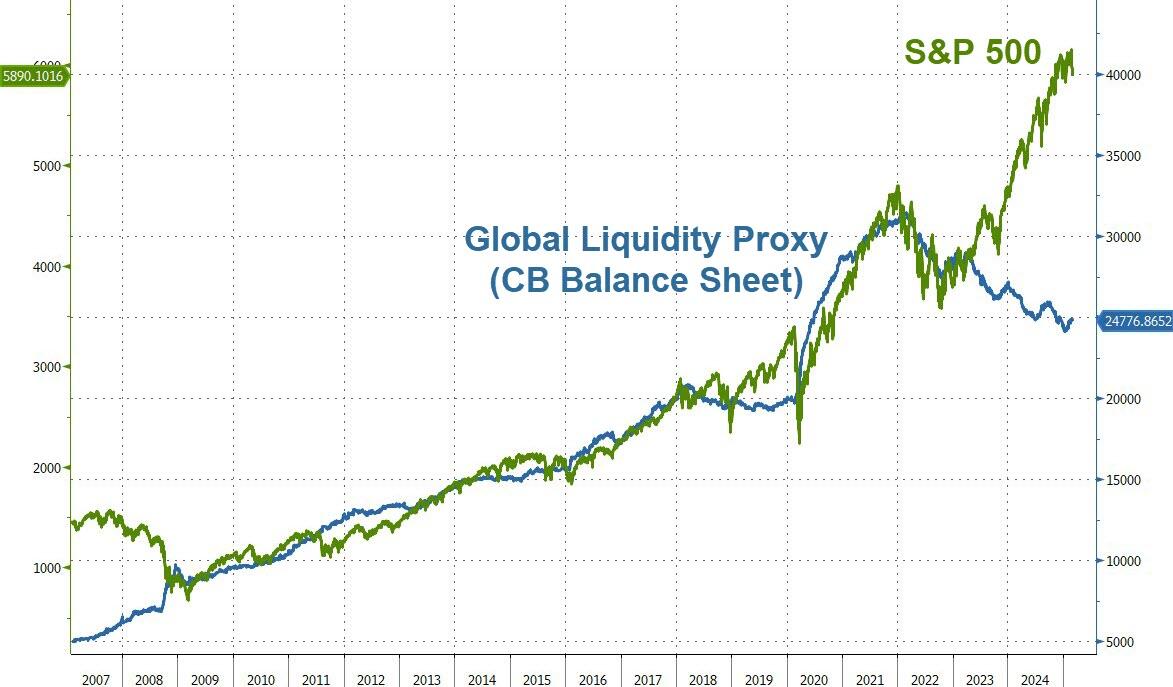
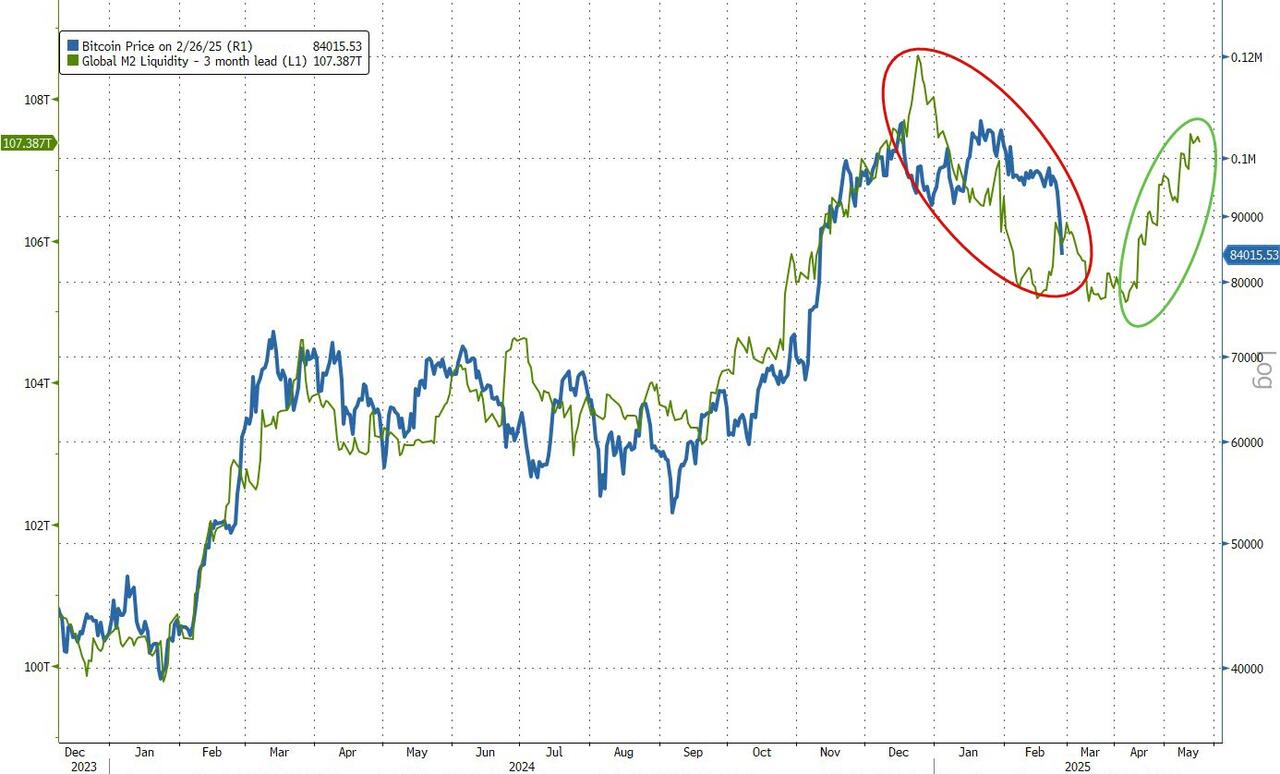
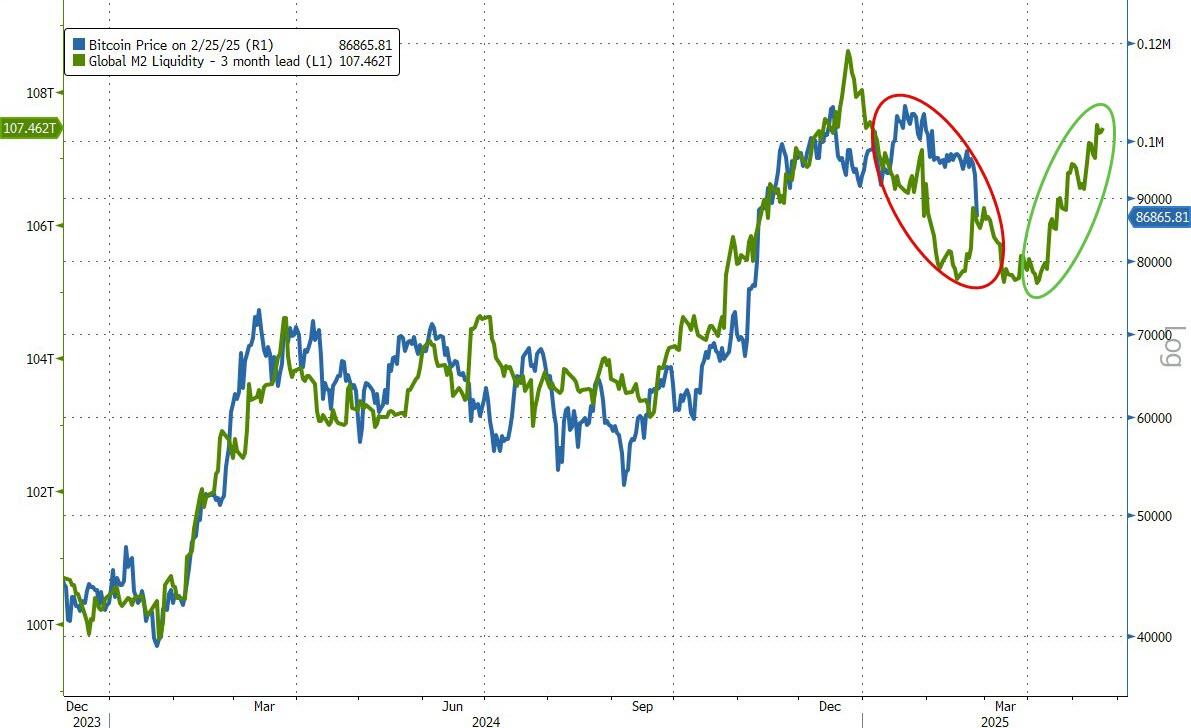
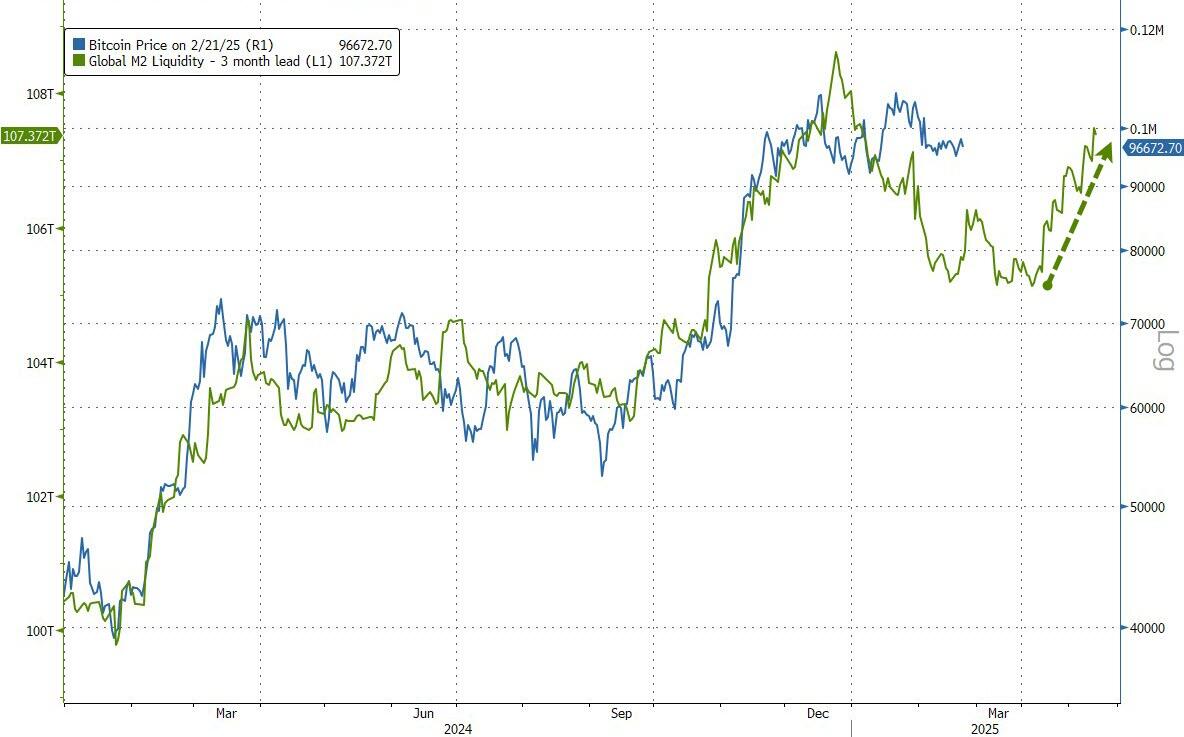
Both Bitcoin and the S&P 500 follow global liquidity, as shown by this chart, which highlights a divergence in dire need of correction.
Will this correction happen on the last trading day of February?
Read More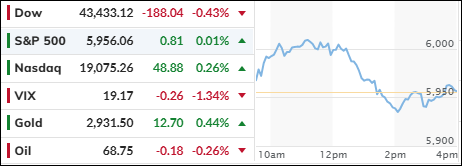