
ETF Tracker StatSheet
You can view the latest version here.
STOCKS RALLY AMID SURGING GOLD AND OIL PRICES: CAN THE TREND CONTINUE?
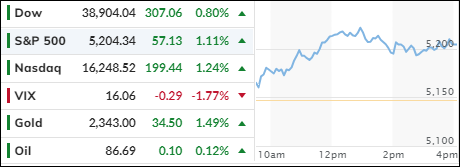
[Chart courtesy of MarketWatch.com]
- Moving the markets
Stocks made a robust recovery on Friday morning, bouncing back from the index’s most significant downturn in over a year.
Investors welcomed the news of a jobs report that surpassed expectations, despite a concurrent rise in interest rates. The job market expanded by 303,000 positions in March, exceeding forecasts, while the unemployment rate held steady at 3.8%, aligning with predictions. A closer examination revealed that most of these new jobs were part-time positions.
Following the jobs report, Treasury yields saw an uptick, and stock prices experienced volatility. The market is caught in a tug-of-war, with traders desiring a robust economy to bolster corporate earnings on one hand, and on the other, hoping for a softer jobs market that would prompt the Federal Reserve to start reducing interest rates.
This conundrum highlights the resilience of the U.S. economy, which has largely withstood the impact of rising rates. After Thursday’s Wall Street selloff, where the Dow plunged approximately 530 points or 1.35%—its sharpest decline since March 2023—stocks have shown weakness as interest rates continue an upward trend.
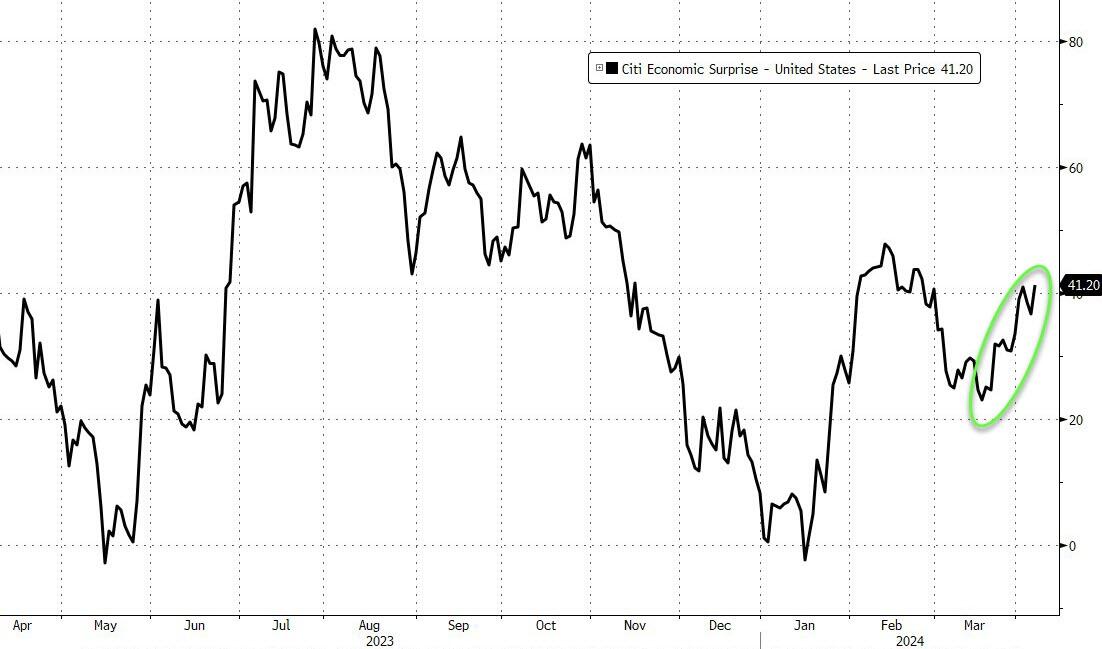
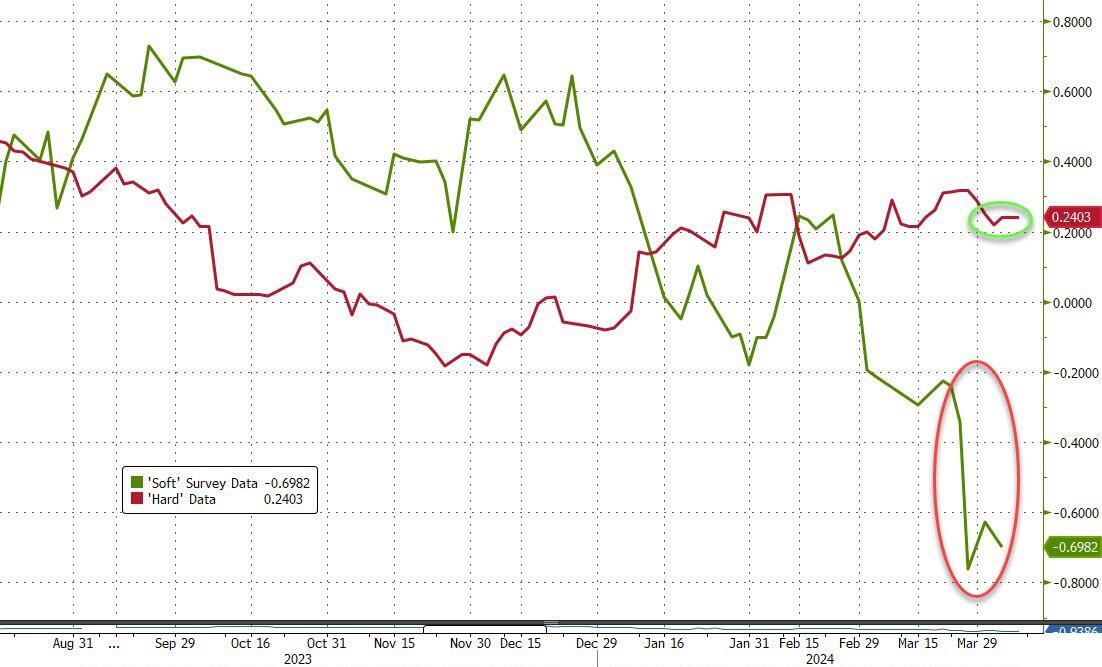
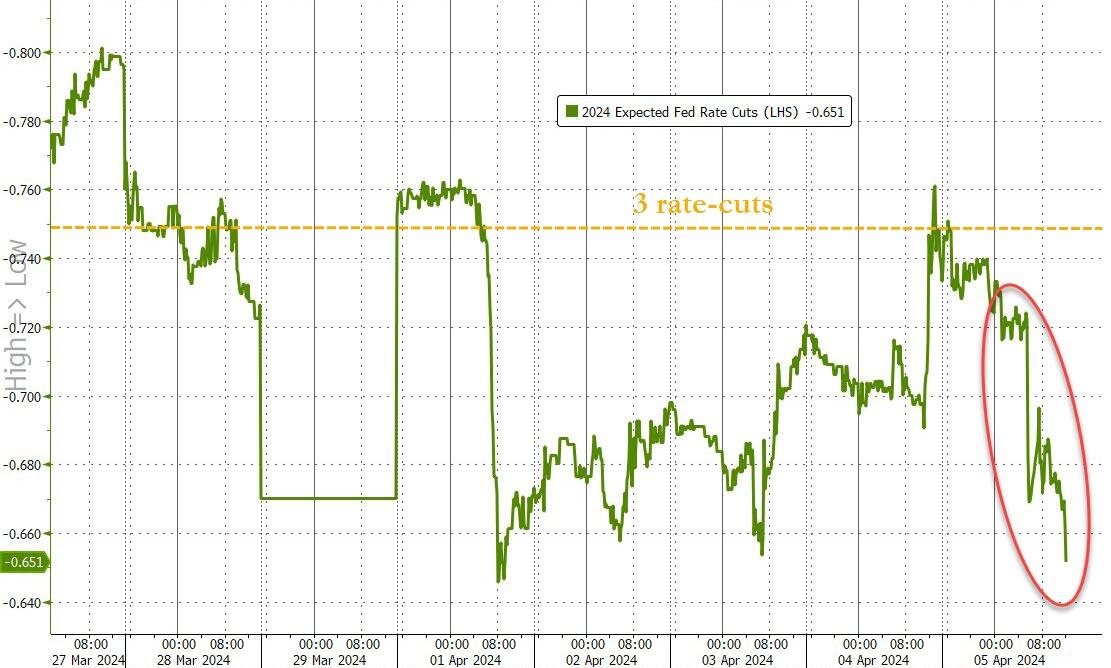
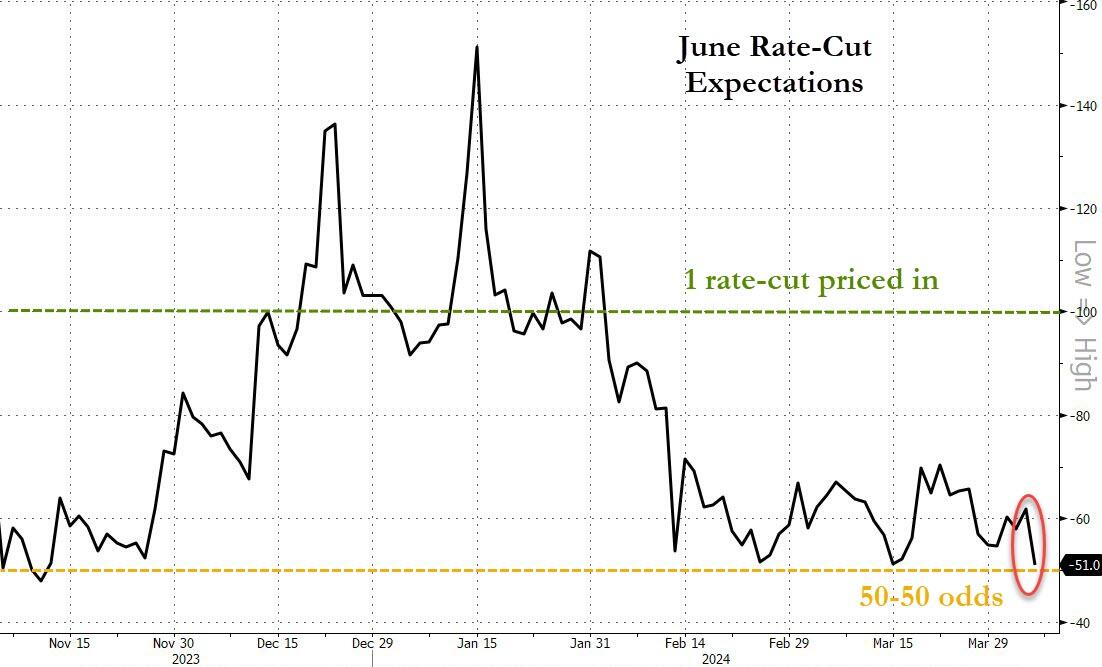
While macroeconomic data presented a positive outlook this week, survey data remained subdued, contrasting with the more robust hard data. Consequently, expectations for interest rate cuts in 2024 have diminished, with June predictions now uncertain.
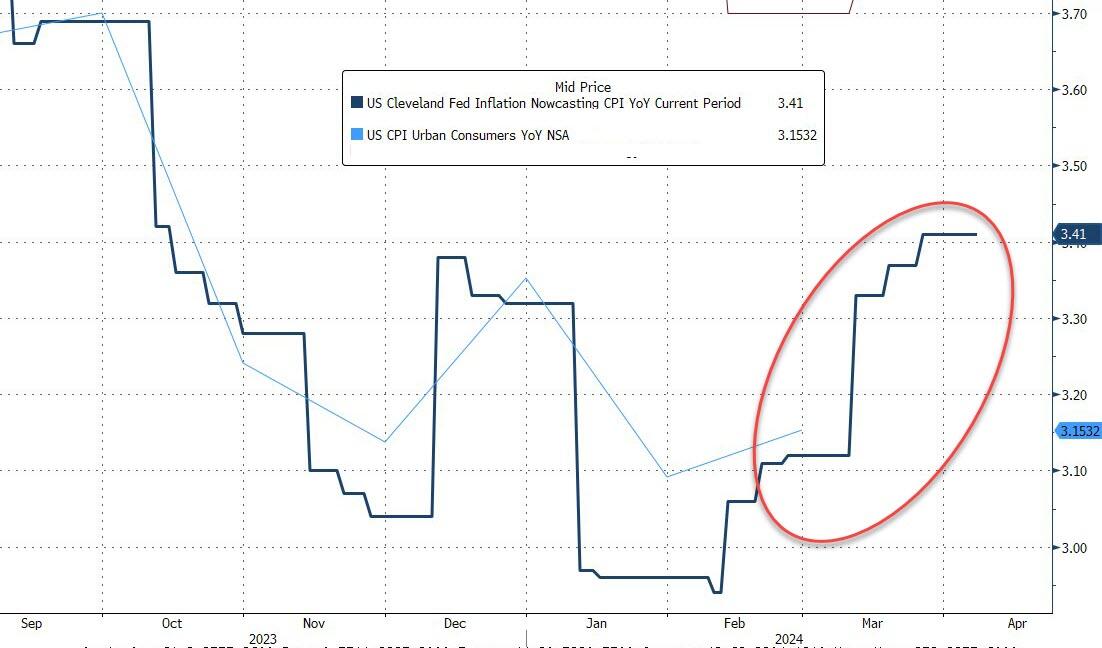
Inflation expectations, which had been tempered, are climbing once again. Despite this, stocks rallied until a statement from the Fed’s Bowman regarding stalled inflation progress curbed investor enthusiasm:
“Inflation progress has stalled; won’t be comfortable cutting until disinflation returns.”
This comment caused stocks to retreat from their peak levels, yet the market closed with a bullish tone.
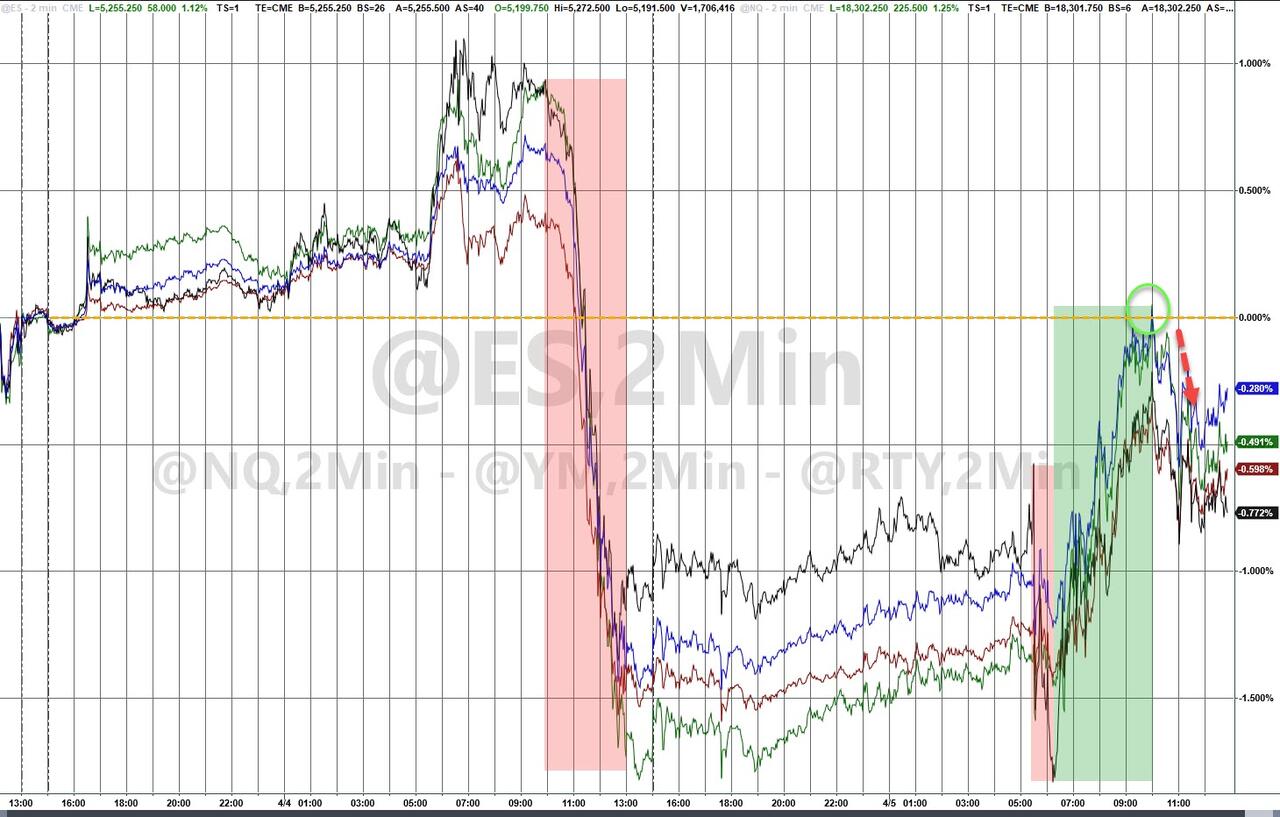
Over the week, the major indexes ended in negative territory, with Small Caps and the Dow leading the decline, while the MAG7 managed a slight weekly increase.
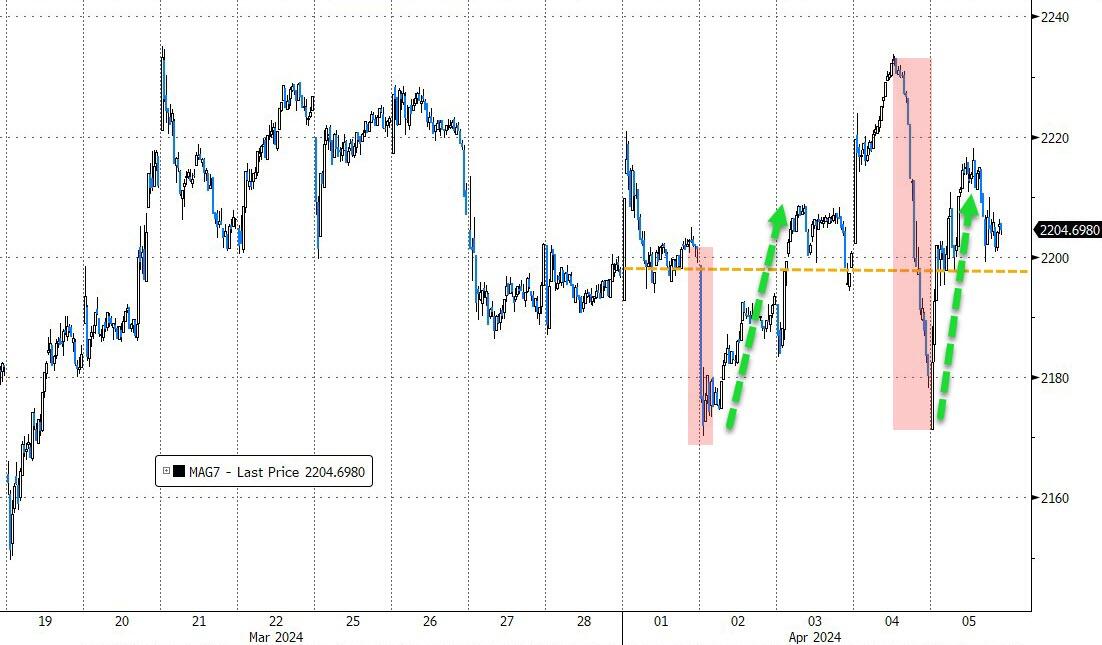
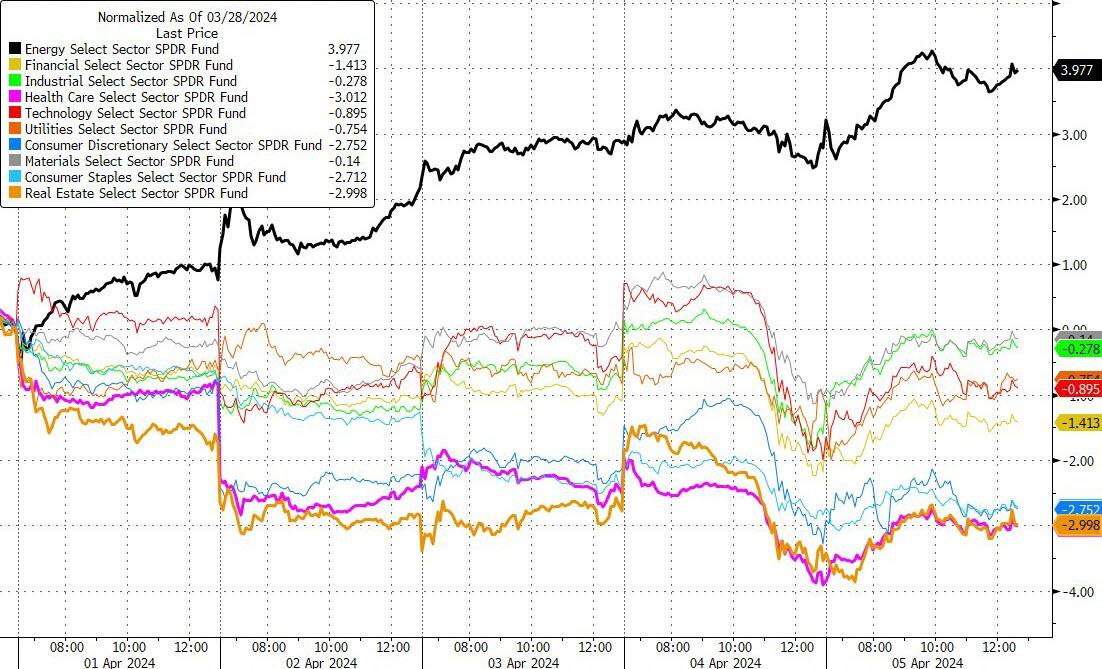
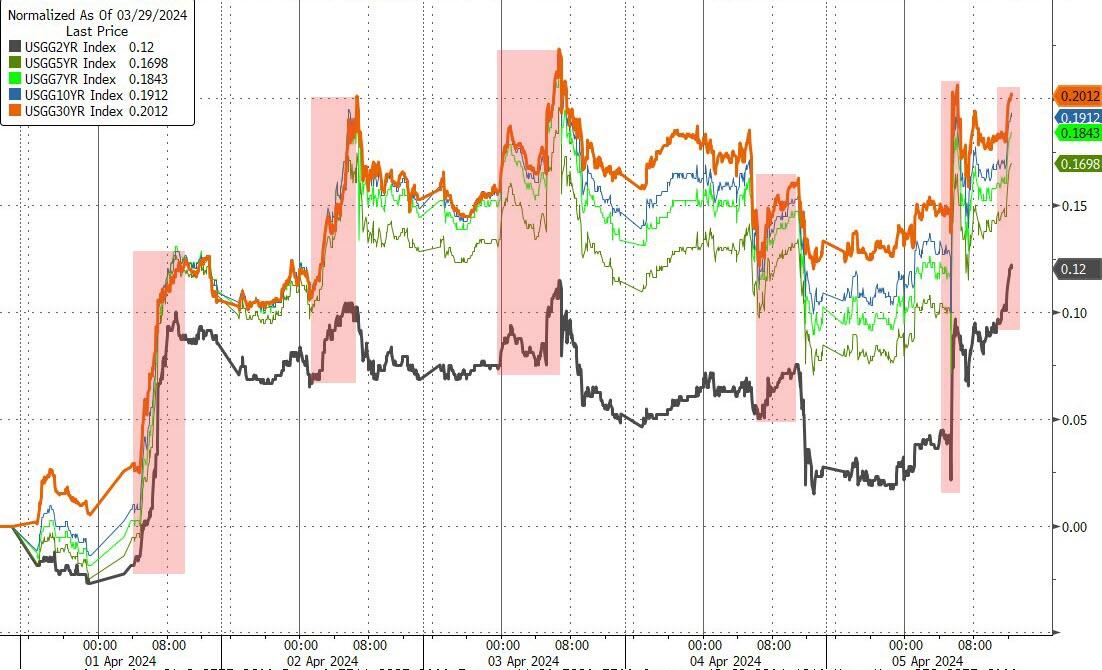
The energy sector shined, ending the week as the only sector in the green. Bond yields rose, with the 2-year nearing year-to-date highs.
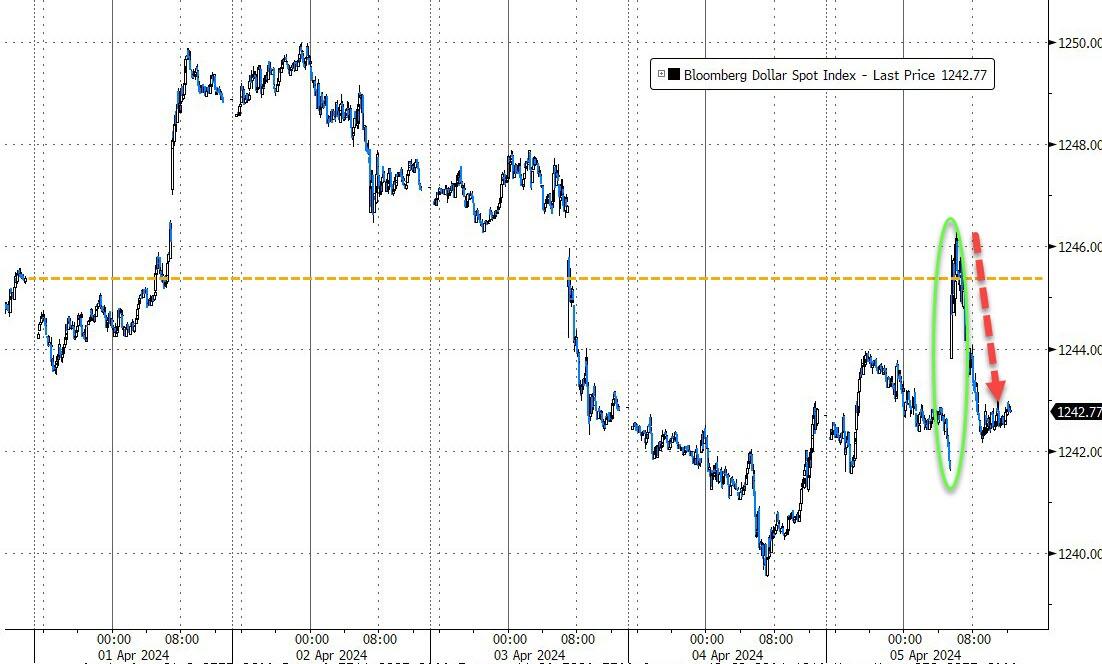
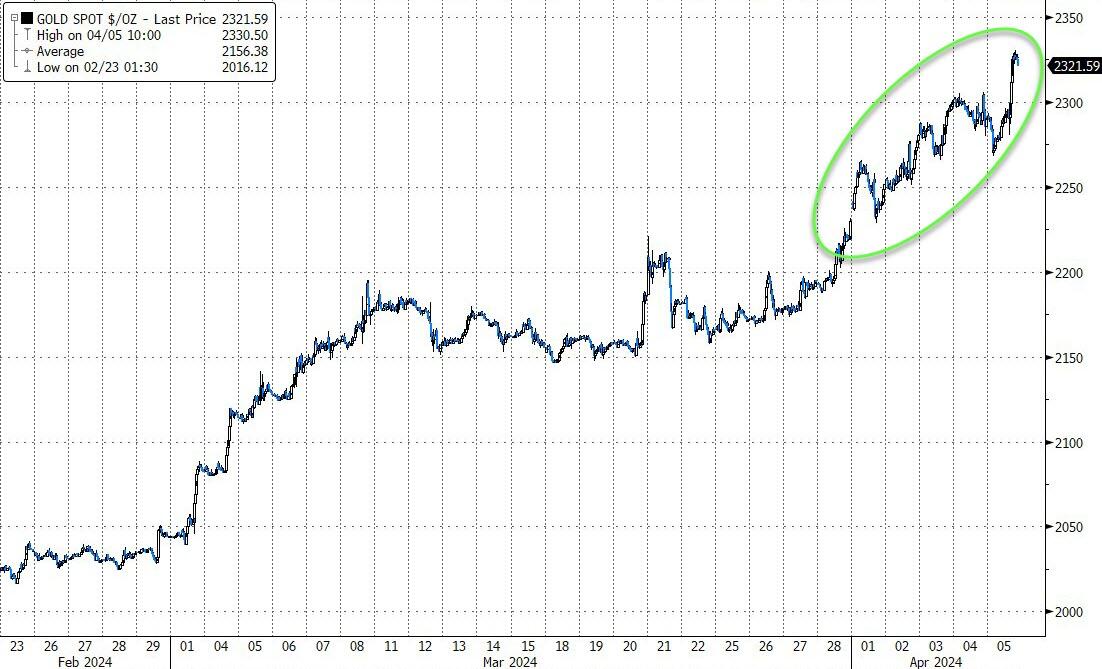
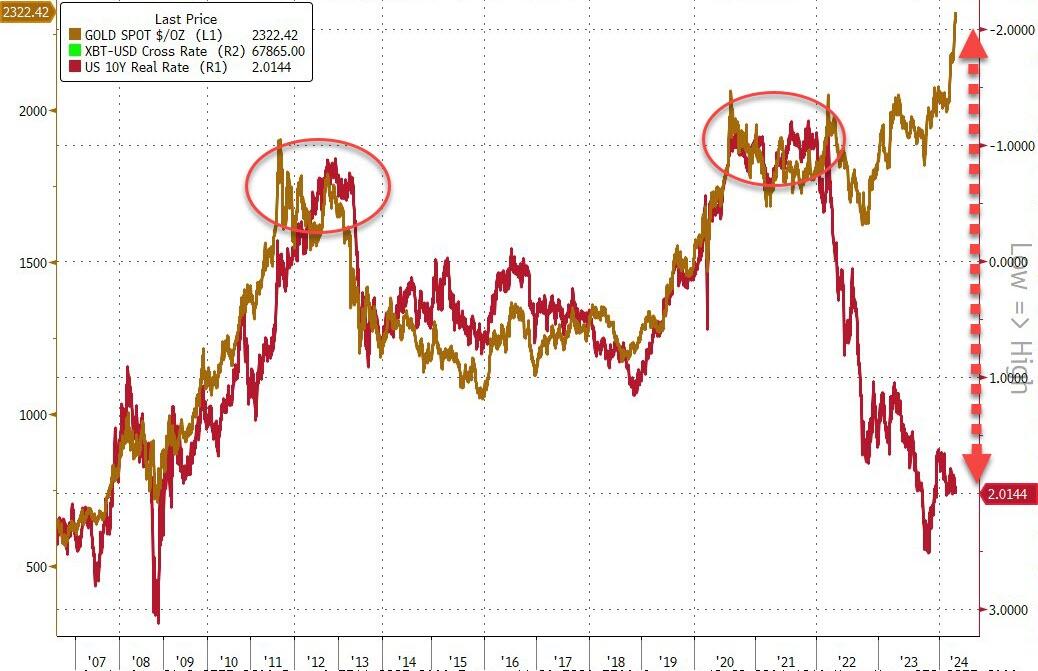
The dollar fluctuated and ended slightly lower, but gold was the standout performer, reaching a new record high above $2,330. Gold has been on an upward trend, rising for 9 of the last 10 days and 6 of the past 7 weeks.
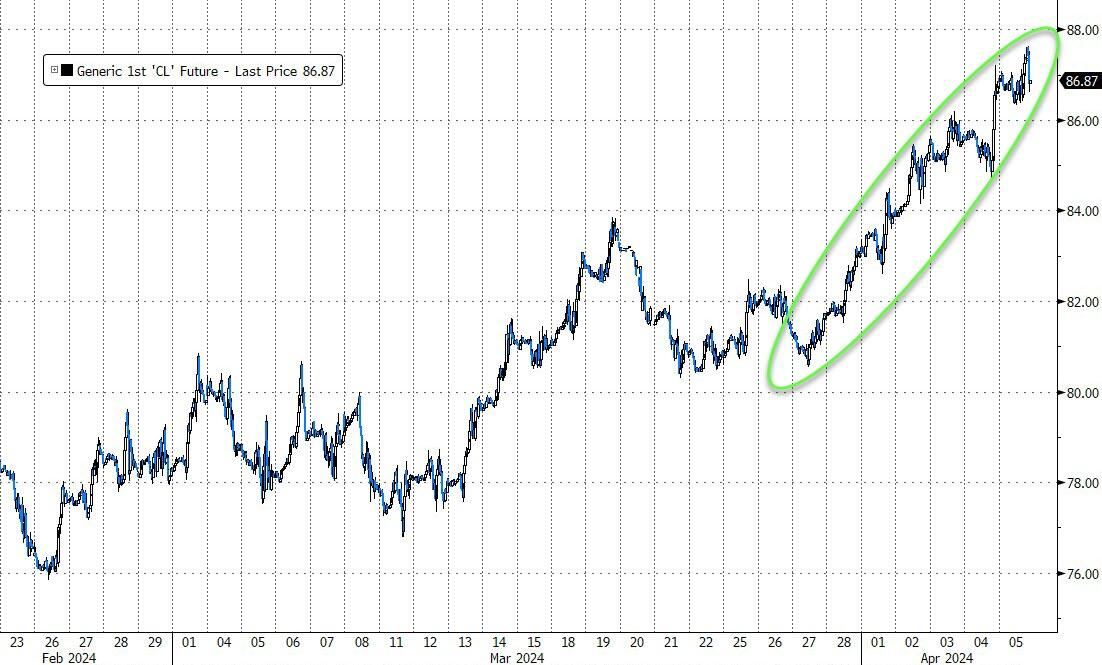
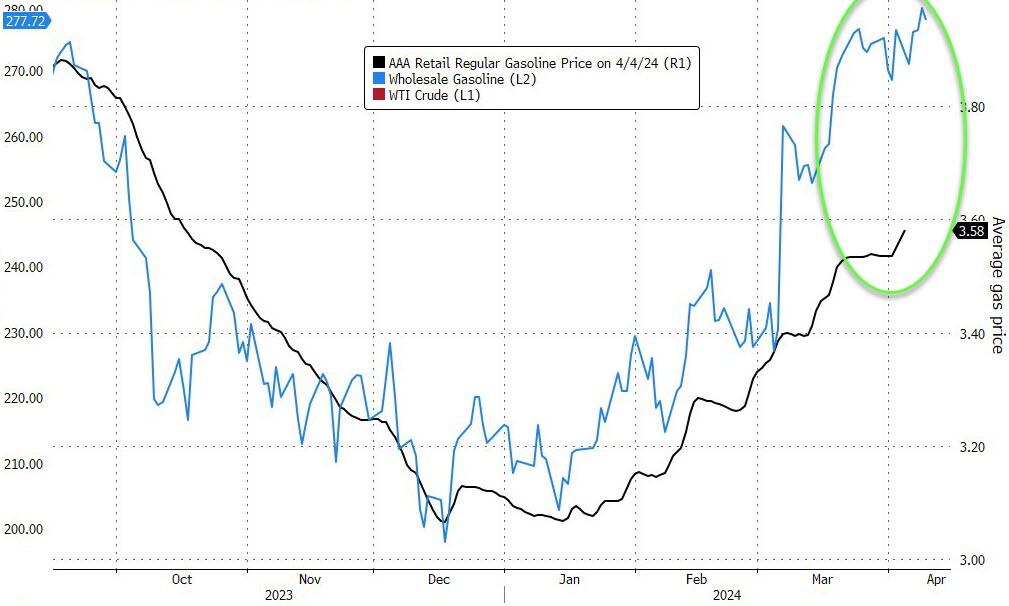
Crude oil prices also climbed, surpassing $87.50, largely driven by escalating geopolitical tensions, which in turn pushed gasoline and pump prices higher.
The ongoing disparity between gold prices and the 10-year yield raises questions about the sustainability of this divergence.
How long can this trend persist before we see a significant shift in the financial system?
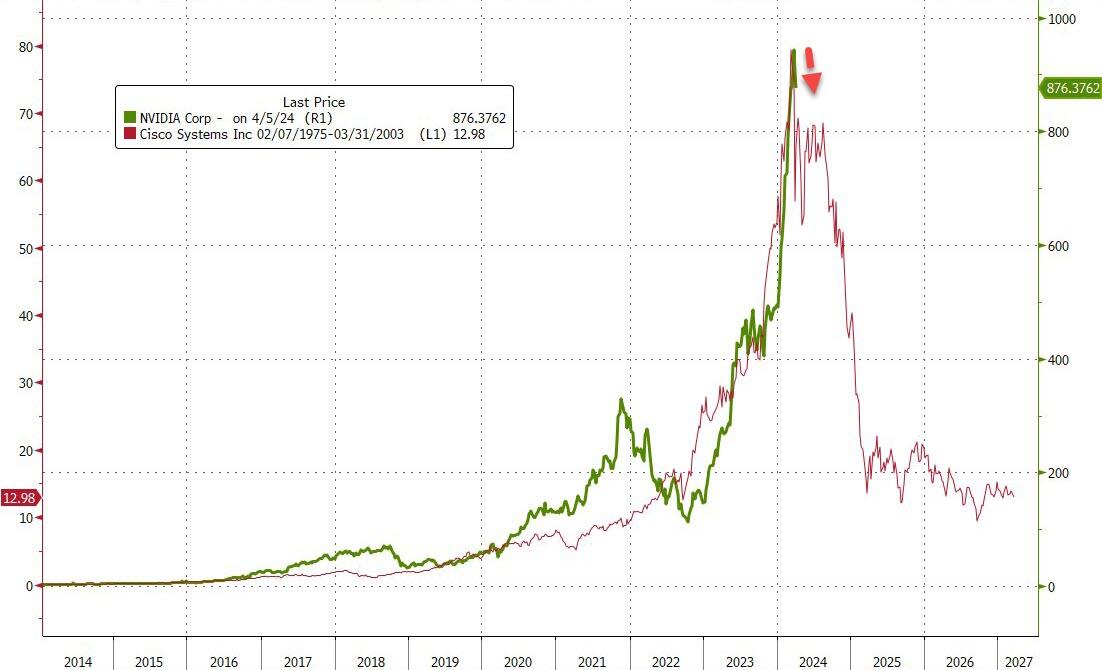
With Nvidia’s shares having fallen 11% from their all-time high last month, I wonder if this chart holds the key to this puzzle?
2. Current “Buy” Cycles (effective 11/21/2023)
Our Trend Tracking Indexes (TTIs) have both crossed their trend lines with enough strength to trigger new “Buy” signals. That means, Tuesday, 11/21/2023, was the official date for these signals.
If you want to follow our strategy, you should first decide how much you want to invest based on your risk tolerance (percentage of allocation). Then, you should check my Thursday StatSheet and Saturday’s “ETFs on the Cutline” report for suitable ETFs to buy.
3. Trend Tracking Indexes (TTIs)
Following yesterday’s significant losses, the stock market rebounded strongly in today’s trading, ending the session on a positive note. Despite today’s recovery, the major indices ended the week lower, relinquishing a portion of their recent robust gains.
Our TTIs displayed divergent performances today; the domestic index experienced an increase, while the international index saw a slight decline.
This is how we closed 4/05/2024:
Domestic TTI: +9.88% above its M/A (prior close +9.62%)—Buy signal effective 11/21/2023.
International TTI: +9.32% above its M/A (prior close +9.78%)—Buy signal effective 11/21/2023.
All linked charts above are courtesy of Bloomberg via ZeroHedge.
———————————————————-
WOULD YOU LIKE TO HAVE YOUR INVESTMENTS PROFESSIONALLY MANAGED?
Do you have the time to follow our investment plans yourself? If you are a busy professional who would like to have his portfolio managed using our methodology, please contact me directly to get more details.
—————————————————————-
Contact Ulli