
1. Moving the Markets
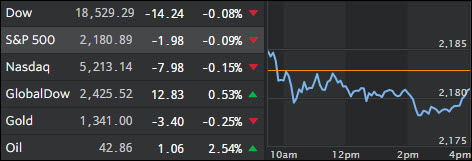
Stocks retreated a bit from last week’s record closes on the heels of an alleged strong jobs report. Equities, which had been stuck in a holding pattern after hitting fresh highs in late July, rallied Friday after the government reported that a better-than-expected 255,000 jobs were created in July. It was the second straight month of employment gains, which reinforced the hope that the U.S. economy and consumers remains alive after a weak start to the year.
In M&A news, we heard that Walmart (WMT) will acquire e-commerce start-up Jet.com in a $3 billion cash deal aimed at helping the world’s largest retailer become an online shopping powerhouse that can take on Amazon.com. Online sales are still just a fraction of Walmart’s overall business, coming in at $13.6 billion last year out of $482 billion in total revenue.
This week’s release of data on June retail sales, a slew of earnings reports from U.S. retailers and the first look at August consumer confidence will be critical to potentially keeping alive a stock rally. Tuesday, we’ll hear from Coach (COH) and Walt Disney (DIS). Wednesday comes apparel maker Ralph Lauren (RL), followed by Macy’s (M) and Nordstrom (JWM). Friday will be the release of July retail sales.
2. ETFs in the Spotlight
In case you missed the announcement and description of this section, you can read it here again.
It features 10 broadly diversified ETFs from my HighVolume list as posted every Monday. Furthermore, they are screened for the lowest MaxDD% number meaning they have been showing better resistance to temporary sell offs than all others over the past year.
Here are the 10 candidates:
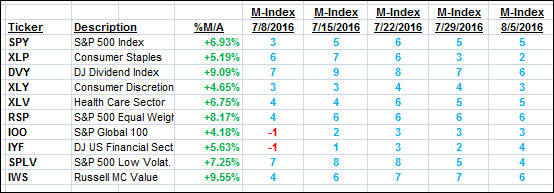
The above table simply demonstrates the magnitude with which some of the ETFs are fluctuating in regards to their positions above or below their respective individual trend lines (%M/A). A break below, represented by a negative number, shows weakness, while a break above, represented by a positive percentage, shows strength.
For hundreds of ETF choices, be sure to reference Thursday’s StatSheet.
Year to date, here’s how the above candidates have fared so far:
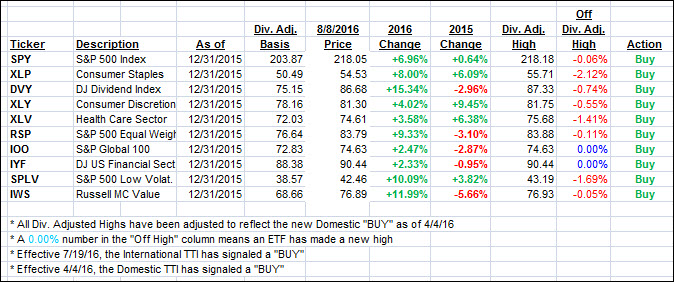
Again, the first table above shows the position of the various ETFs in relation to their respective long term trend lines (%M/A), while the second one tracks their trailing sell stops in the “Off High” column. The “Action” column will signal a “Sell” once the -7.5% point has been taken out in the “Off High” column.
3. Trend Tracking Indexes (TTIs)
Our Trend Tracking Indexes (TTIs) showed a mixed picture with the Domestic one slipping while the International jumped a bit.
Here’s how we closed 8/8/2016:
Domestic TTI: +3.02% (last close +3.13%)—Buy signal effective 4/4/2016
International TTI: +3.74% (last close +3.53%)—Buy signal effective 7/19/2016
Disclosure: I am obliged to inform you that I, as well as my advisory clients, own some of the ETFs listed in the above table. Furthermore, they do not represent a specific investment recommendation for you, they merely show which ETFs from the universe I track are falling within the guidelines specified.
Contact Ulli