Treading Water

Ulli Market Commentary Contact

tue-pic

[Chart courtesy of MarketWatch.com]

1. Moving the Markets

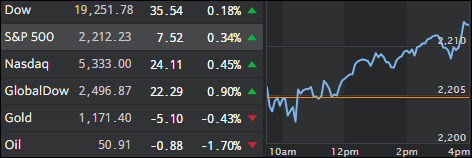
Stocks inched slightly higher Tuesday ahead of Wednesday’s interest rate decision from the Federal Reserve. There is not much hype to get jittery about this time around, as most believe that there is no hike slated for this year. Also on deck for tomorrow: A rate policy announcement from the Japanese.

Shares of ExxonMobil (XOM) fell Tuesday amid a report that a federal regulator is investigating some of the U.S. energy giant’s accounting practices. The SEC is probing how the company valued its assets during the continuing plunge in global oil prices, as well as how it estimates future asset values. Apparently, there are numerous other U.S. energy companies that have written down the value of their drilling assets by about $177 billion last year. Thus, eyebrows are raised to say the least.

In the world of merchandise retail, we heard today that Kmart is going to close 64 stores across the U.S. beginning on Sept. 22. Both Sears (its parent company) and Kmart have had a difficult time remaining profitable and competitive in a retail environment increasingly dominated by other mass market chains and e-commerce sites like Amazon.

Other dreadful data included a plunge in housing starts, the biggest in 5 months, with building permits slipping for the second month in a row. But not to worry, home builder confidence is surging. Go figure…

Read More

A Failed Rally

Ulli Market Commentary Contact

mon-pic

[Chart courtesy of MarketWatch.com]

1. Moving the Markets

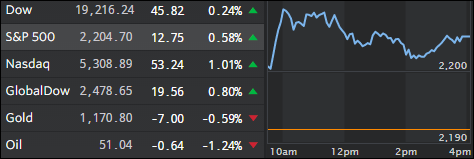
An early rally attempt failed with the major indexes slowly but surely retreating and ending just about unchanged. Anxiety prevailed as Wall Street awaits Wednesday’s key Federal Reserve decision on interest rates. To me, it’s a foregone conclusion that the Fed, for a variety of reasons, such as consistently weakening economic data points and obvious support for the incumbent party, will not raise rates.

Of course, the Fed could always go against expectations and hike for the first time in 2016, but I think that their memories of the last episode, when rates were raised in December of 2015—and its bearish effect on the markets—remain vividly present.

Read More

One Man’s Opinion: Welcome To Fantasy Land

Ulli Market Review Contact

OneMan'sOpinionBy Peter Schiff via Euro Pacific Capital

For years I have argued that ultra-low interest rates act more as an economic sedative than a stimulant. This idea has elicited laughter from the economic establishment. But it is becoming clearer that rates set by central banks that are far below the levels that free markets would have otherwise determined have dragged the world into the economic mud. The simple proof is currently arising in Europe where negative interest rates are now transforming companies from agents of growth, production, and employment into financial sloths that exist solely to borrow money.

In a September 7 front page article, the Wall Street Journal reported that as of September 5, €706 billion worth of investment-grade European corporate debt, or roughly 30% of the market, according to trading platform Tradeweb, was trading at negative yields, an increase from just 5% in January. These negative yields were the result of intense activism on the part of the European Central Bank (ECB).

For years the ECB had been trying to stimulate growth by buying trillions of euros’ worth of sovereign debt. But as these programs proved ineffective to wake up the EU economy from its long economic slumber, this year they began moving into the corporate market. Most of this buying has occurred on the secondary market, for bonds that had previously been issued at positive rates. The central bank buying raised prices of these bonds sufficiently to push yields into negative territory. It also has drawn in speculators who have bought low yielding bonds not because they are good investments but because they are convinced that the ECB will one day buy them out at a premium.

Read More

ETFs On The Cutline – Updated Through 09/16/2016

Ulli ETFs on the Cutline Contact

Below please find the latest High Volume ETF Cutline report, which shows how far above or below their respective long-term trend lines (39 week SMA) my currently tracked ETFs are positioned.

This report covers the HV ETF Master List from Thursday’s StatSheet and includes 366 High Volume ETFs ETFs, defined as those with an average daily volume of more than $5 million, of which currently 306 (last week 318) are hovering in bullish territory. The yellow line separates those ETFs that are positioned above their trend line from those that have dropped below it.

Take a look:

The HV ETF Master Cutline Report  

In case you are not familiar with some of the terminology used in the reports, please read the Glossary of Terms.

If you missed the original post about the Cutline approach, you can read it here.

ETF Tracker Newsletter For September 16, 2016

Ulli ETF Tracker Contact

ETF Tracker StatSheet

————————————————————-

https://theetfbully.com/2016/09/weekly-statsheet-for-the-etf-tracker-newsletter-updated-through-09152016/

————————————————————

Market Commentary

MID-SEPTEMBER REMAINS VOLATILE

fri-pic

[Chart courtesy of MarketWatch.com]

1. Moving the Markets

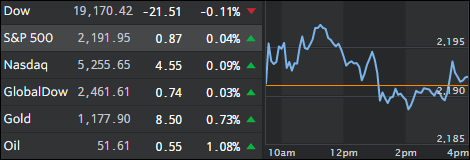
It has been a volatile week to say the least. The Dow Jones Industrial average ended slightly lower today to round out the week on Wall Street. Traders are once again looking ahead to next week’s Fed meeting on interest rates to see if they can decipher any meaningful info that could be utilized to secure gains.

The Dow closed up about 90 points for the week. And while the wild market swings continue (as investors gauge whether central banks will continue to support markets at levels of the past) the moves have transitioned towards the upside after last Friday’s nearly 400-point rout. While the Dow has posted three triple-digit moves this week, two of them have been of the bullish flavor. The Dow soared nearly 200 points yesterday, offsetting a nearly 260-point drop Tuesday, thus volatility remains the word moving forward.

In banking news, the U.S. Justice Department is seeking a $14 billion civil settlement with Deutsche Bank (DB) over the German financial institution’s alleged role in artificially propping up the U.S. housing market leading up to the Great Recession back in 2008. Deutsche Bank shares traded in New York plunged 8.4% to $13.50 in pre-market action Friday after the company confirmed that justice negotiators had staked out “an opening position” of $14 billion in their discussions. Ouch!

Read More

Weekly StatSheet For The ETF Tracker Newsletter – Updated Through 09/15/2016

Ulli ETF StatSheet Contact

ETF Data updated through Thursday, September 15, 2016

TOC082516

Methodology/Use of this StatSheet:

  1. From the universe of over 1,800 ETFs, I have selected only those with a trading volume of over $5 million per day (HV ETFs), so that liquidity and a small bid/ask spread are assured.
  2. Trend Tracking Indexes (TTIs)

Buy or Sell decisions for Domestic and International ETFs (section 1 and 2), are made based on the respective TTI and its position either above or below its long-term M/A (Moving Average). A crossing of the trend line from below accompanied by some staying power above constitutes a “Buy” signal. Conversely, a clear break below the line constitutes a “Sell” signal. Additionally, I use a 7.5% trailing stop loss on all positions in these categories to control downside risk.

  1. All other investment arenas do not have a TTI and should be traded based on the position of the individual ETF relative to its own respective trend line (%M/A). That’s why those signals are referred to as a “Selective Buy.” In other words, if an ETF crosses its own trendline to the upside, a “Buy” signal is generated. Since these areas tend to be more volatile, I recommend a wider trailing sell stop of 7.5% -10% depending on your risk tolerance.

If you are unfamiliar with some of the terminology, please see Glossary of Terms and new subscriber information in section 9.


1. DOMESTIC EQUITY ETFs: BUY — since 4/4/2016

tti

Our main directional indicator, the Domestic Trend Tracking Index (TTI-green line in the above chart) remains above its long-term trend line (red) by +2.29% after having generated a new Domestic Buy signal effective 4/4/2016 as posted.

Read More