
1. Moving the Markets
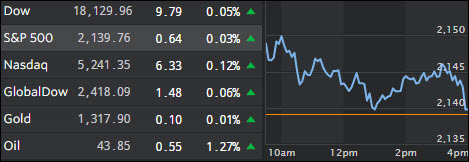
Stocks inched slightly higher Tuesday ahead of Wednesday’s interest rate decision from the Federal Reserve. There is not much hype to get jittery about this time around, as most believe that there is no hike slated for this year. Also on deck for tomorrow: A rate policy announcement from the Japanese.
Shares of ExxonMobil (XOM) fell Tuesday amid a report that a federal regulator is investigating some of the U.S. energy giant’s accounting practices. The SEC is probing how the company valued its assets during the continuing plunge in global oil prices, as well as how it estimates future asset values. Apparently, there are numerous other U.S. energy companies that have written down the value of their drilling assets by about $177 billion last year. Thus, eyebrows are raised to say the least.
In the world of merchandise retail, we heard today that Kmart is going to close 64 stores across the U.S. beginning on Sept. 22. Both Sears (its parent company) and Kmart have had a difficult time remaining profitable and competitive in a retail environment increasingly dominated by other mass market chains and e-commerce sites like Amazon.
Other dreadful data included a plunge in housing starts, the biggest in 5 months, with building permits slipping for the second month in a row. But not to worry, home builder confidence is surging. Go figure…
2. ETFs in the Spotlight
In case you missed the announcement and description of this section, you can read it here again.
It features 10 broadly diversified ETFs from my HighVolume list as posted every Monday. Furthermore, they are screened for the lowest MaxDD% number meaning they have been showing better resistance to temporary sell offs than all others over the past year.
Here are the 10 candidates:
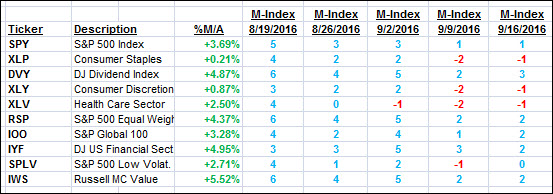
The above table simply demonstrates the magnitude with which some of the ETFs are fluctuating in regards to their positions above or below their respective individual trend lines (%M/A). A break below, represented by a negative number, shows weakness, while a break above, represented by a positive percentage, shows strength.
For hundreds of ETF choices, be sure to reference Thursday’s StatSheet.
Year to date, here’s how the above candidates have fared so far:
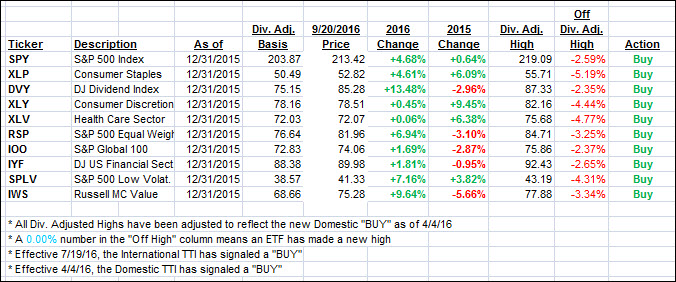
Again, the first table above shows the position of the various ETFs in relation to their respective long term trend lines (%M/A), while the second one tracks their trailing sell stops in the “Off High” column. The “Action” column will signal a “Sell” once the -7.5% point has been taken out in the “Off High” column.
3. Trend Tracking Indexes (TTIs)
In a repeat performance from yesterday, our Trend Tracking Indexes (TTIs) were mixed with the Domestic one inching up while the International remained unchanged.
Here’s how we closed 9/20/2016:
Domestic TTI: +2.05% (last close +2.02%)—Buy signal effective 4/4/2016
International TTI: +3.63% (last close +3.63%)—Buy signal effective 7/19/2016
Disclosure: I am obliged to inform you that I, as well as my advisory clients, own some of the ETFs listed in the above table. Furthermore, they do not represent a specific investment recommendation for you, they merely show which ETFs from the universe I track are falling within the guidelines specified.
Contact Ulli