Upward Momentum Disappears: Stocks AND Bonds Tank

Ulli Market Commentary Contact

tue-pic

[Chart courtesy of MarketWatch.com]

1. Moving the Markets

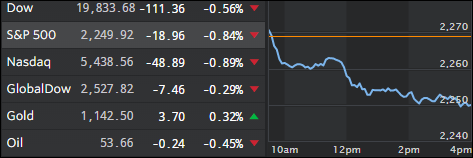
Disappointing corporate reports put the major indexes into negative territory right out of the gate and things went south from there. Those living by the old “chiseled-in-stone” rule that bonds will rally if stocks sell off have to do some rethinking if that meme really still holds true when considering the amount of manipulation Central Banks have gone through to reward Wall Street with index levels totally out of sync with economic fundamentals along with zero and negative interest rates.

I think once next real downturn happens and bond yields surge (prices drop) while equities sink, you will have the worst case scenario for those following the old buy-and-hold strategy, as there will be no offsetting asset class protecting the downside risk inherent in equities. This was exactly what we saw today except the pullback was relatively minor.

Contributing to today’s decline was not only an increase in volatility with the VIX (Volatility Index) jumping almost 15% but also leveraged risk-parity funds being forced to liquidate caused by rates breaking out to the upside. We’ll have to wait and see if this is just a one day pullback or if there is more to come. With market levels having been propped up artificially for so long, anything is possible. Be sure to have your exit strategy planned and in place in case things get ugly.

Read More

Energy Sector Pulls Up Wall Street

Ulli Market Commentary Contact

mon-pic

[Chart courtesy of MarketWatch.com]

1. Moving the Markets

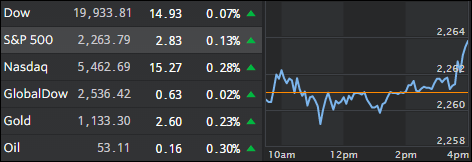
The major indexes headed higher as energy shares and oil prices proved to be the catalyst to drive the markets. Helping the advance were polls allegedly showing that Hillary Clinton’s lead over Trump widened, at least that’s what MSM was heavily promoting. Clinton’s views are well known and considered to be positive for equities.

Also assisting the market was heavy weight Apple, whose shares jumped higher as a result of the worsening recall crisis by Samsung, its main competitor. The US bond markets were closed due to the Columbus Day and there were no economic news on the calendar. Gold and the US dollar both rallied.

I have repeatedly posted graphs and commented on the divergence between the S&P 500, or the entire US stock market for that matter, and underlying realities such as earnings and GDP expectations. The dilemma is not just limited to the US but exists globally as well. Take a look at this chart, courtesy of ZH, which shows the effect of Central Bank market manipulation at its finest:

Read More

One Man’s Opinion: Yellen Says Fed Buying Stocks Is “A Good Thing To Think About” And Could Help In A Downturn

Ulli Market Review Contact

OneMan'sOpinionBy ZeroHedge

Having hinted overnight that The Fed could buy stocks “maybe in the future,” Janet Yellen blurted out confirmation that buying assets other than long-term U.S. debt is on the table. Despite the total and utter failure of SNB and BOJ direct equity buying to create increased consumption, Yellen explained “it could be useful to be able to intervene directly in assets where the prices have a more direct link to spending decisions.”

Speaking via videoconference in response to questions raised at forum of Kansas City Fed minority bankers, Fed Chair Janet Yellen says there could be benefits to Fed buying equities or corporate bonds, yet would also likely be costs that have to be considered.

The idea of expanding into areas like equities might be “good thing to think about,” yet is not “something we need now,” Yellen said, noting that (for now) The Fed is more restricted in which assets it can purchase than other central banks.

Read More

ETFs On The Cutline – Updated Through 10/07/2016

Ulli ETFs on the Cutline Contact

Below please find the latest High Volume ETFs Cutline report, which shows how far above or below their respective long-term trend lines (39 week SMA) my currently tracked ETFs are positioned.

This report covers the HV ETF Master List from Thursday’s StatSheet and includes 366 High Volume ETFs ETFs, defined as those with an average daily volume of more than $5 million, of which currently 280 (last week 325) are hovering in bullish territory. The yellow line separates those ETFs that are positioned above their trend line from those that have dropped below it.

Take a look:

The HV ETF Master Cutline Report  

In case you are not familiar with some of the terminology used in the reports, please read the Glossary of Terms.

If you missed the original post about the Cutline approach, you can read it here.

ETF Tracker Newsletter For October 7, 2016

Ulli Market Commentary Contact

ETF Tracker StatSheet

————————————————————-

https://theetfbully.com/2016/10/weekly-statsheet-for-the-etf-tracker-newsletter-updated-through-10062016/

————————————————————

Market Commentary

SUBDUED JOBS REPORT IS A NON-EVENT

fri-pic

[Chart courtesy of MarketWatch.com]

1. Moving the Markets

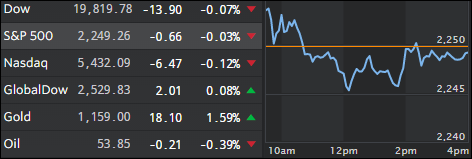
Reaction to the September jobs report was subdued at best as the print came in at a gain of 156k, which was weaker than expected. The theme was the same as in previous months in that part-time jobs surged, full-time jobs dipped and multiple job holders jumped. In other words, more than 50% of the jobs added went to minimum wage workers. That’s not really the stuff necessary to confirm a growing economy, which is why wage growth is pretty much absent with the exception of mandatory minimum wage increases.

What that translates to is that the feared upcoming rate hike in November is out the window and December has become very questionable as rate hike odds have tumbled. Of course, things can change as the Fed has two more jobs reports on deck before their final meeting for 2016 in mid-December.

The major indexes meandered mainly below the unchanged line with the S&P 500 closing down -0.33% for the day and -0.65% for the week. The best performer for the day was Healthcare while Basic Materials were the laggard.

Read More

Weekly StatSheet For The ETF Tracker Newsletter – Updated Through 10/06/2016

Ulli ETF StatSheet Contact

ETF Data updated through Thursday, October 6, 2016

TOC082516

Methodology/Use of this StatSheet:

  1. From the universe of over 1,800 ETFs, I have selected only those with a trading volume of over $5 million per day (HV ETFs), so that liquidity and a small bid/ask spread are assured.
  2. Trend Tracking Indexes (TTIs)

Buy or Sell decisions for Domestic and International ETFs (section 1 and 2), are made based on the respective TTI and its position either above or below its long-term M/A (Moving Average). A crossing of the trend line from below accompanied by some staying power above constitutes a “Buy” signal. Conversely, a clear break below the line constitutes a “Sell” signal. Additionally, I use a 7.5% trailing stop loss on all positions in these categories to control downside risk.

  1. All other investment arenas do not have a TTI and should be traded based on the position of the individual ETF relative to its own respective trend line (%M/A). That’s why those signals are referred to as a “Selective Buy.” In other words, if an ETF crosses its own trendline to the upside, a “Buy” signal is generated. Since these areas tend to be more volatile, I recommend a wider trailing sell stop of 7.5% -10% depending on your risk tolerance.

If you are unfamiliar with some of the terminology, please see Glossary of Terms and new subscriber information in section 9.


1. DOMESTIC EQUITY ETFs: BUY — since 4/4/2016

tti

Our main directional indicator, the Domestic Trend Tracking Index (TTI-green line in the above chart) remains above its long-term trend line (red) by +2.14% after having generated a new Domestic Buy signal effective 4/4/2016 as posted.

Read More