
1. Moving the Markets
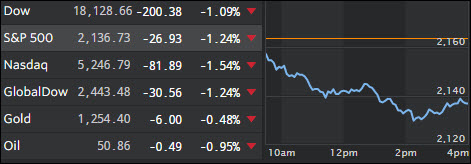
Disappointing corporate reports put the major indexes into negative territory right out of the gate and things went south from there. Those living by the old “chiseled-in-stone” rule that bonds will rally if stocks sell off have to do some rethinking if that meme really still holds true when considering the amount of manipulation Central Banks have gone through to reward Wall Street with index levels totally out of sync with economic fundamentals along with zero and negative interest rates.
I think once next real downturn happens and bond yields surge (prices drop) while equities sink, you will have the worst case scenario for those following the old buy-and-hold strategy, as there will be no offsetting asset class protecting the downside risk inherent in equities. This was exactly what we saw today except the pullback was relatively minor.
Contributing to today’s decline was not only an increase in volatility with the VIX (Volatility Index) jumping almost 15% but also leveraged risk-parity funds being forced to liquidate caused by rates breaking out to the upside. We’ll have to wait and see if this is just a one day pullback or if there is more to come. With market levels having been propped up artificially for so long, anything is possible. Be sure to have your exit strategy planned and in place in case things get ugly.
2. ETFs in the Spotlight
In case you missed the announcement and description of this section, you can read it here again.
It features 10 broadly diversified ETFs from my HighVolume list as posted every Monday. Furthermore, they are screened for the lowest MaxDD% number meaning they have been showing better resistance to temporary sell offs than all others over the past year.
Here are the 10 candidates:
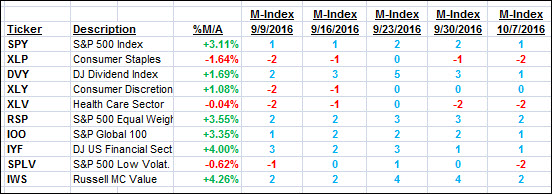
The above table simply demonstrates the magnitude with which some of the ETFs are fluctuating in regards to their positions above or below their respective individual trend lines (%M/A). A break below, represented by a negative number, shows weakness, while a break above, represented by a positive percentage, shows strength.
For hundreds of ETF choices, be sure to reference Thursday’s StatSheet.
Year to date, here’s how the above candidates have fared so far:
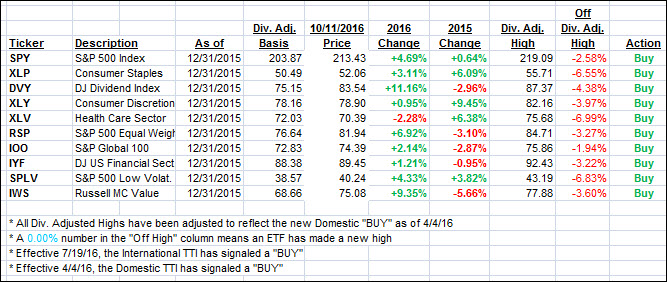
Again, the first table above shows the position of the various ETFs in relation to their respective long term trend lines (%M/A), while the second one tracks their trailing sell stops in the “Off High” column. The “Action” column will signal a “Sell” once the -7.5% point has been taken out in the “Off High” column.
3. Trend Tracking Indexes (TTIs)
Both of our Trend Tracking Indexes (TTIs) reversed and headed south as upward momentum was non-existent.
Here’s how we closed 10/11/2016:
Domestic TTI: +1.58% (last close +2.08%)—Buy signal effective 4/4/2016
International TTI: +3.28% (last close +4.36%)—Buy signal effective 7/19/2016
Disclosure: I am obliged to inform you that I, as well as my advisory clients, own some of the ETFs listed in the above table. Furthermore, they do not represent a specific investment recommendation for you, they merely show which ETFs from the universe I track are falling within the guidelines specified.
Contact Ulli