
- Moving the Markets
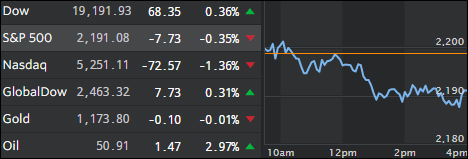
It was a tale of two markets with the Dow still pushing into record territory while the Nasdaq tanked and closed below the unchanged line joined by the S&P 500. The Dow’s support came from the banking and energy sector, the latter which was powered by continued strength in oil prices (+2.97%) as the recent OPEC agreement apparently has not been reneged on—yet.
In economic headlines, the initial jobless claims took front and center. In the two weeks since the election they have soared over 35,000 (or 15%) to five month highs, the biggest two week rise since December 2014. As the ZH succinctly noted, “this is entirely against the exuberant narrative being spun by the US equity markets.”
On the interest rate front, the bloodbath continued with yields soaring worldwide as the 10-year US bond gained some 6 basis points to close at 2.45%. There will a moment in time when that relentless increase in yields will severely affect US stocks. As I mentioned yesterday in the Trend Tracking section:
It’s important to note that our Domestic TTI has not rallied in its usual fashion, a sign that rising bond yields have generated some headwind, which will play a much bigger (negative) role in regards to equity prices should yields continue to ratchet higher.
I think we are getting closer as our Domestic TTI has now moved within striking distance of a potential “Sell” signal with that oddity occurring in the face of the Dow making new lifetime highs. See section 3 below for today’s closing numbers.
- ETFs in the Spotlight
In case you missed the announcement and description of this section, you can read it here again.
It features 10 broadly diversified ETFs from my HighVolume list as posted every Monday. Furthermore, they are screened for the lowest MaxDD% number meaning they have been showing better resistance to temporary sell offs than all others over the past year.
Here are the 10 candidates:
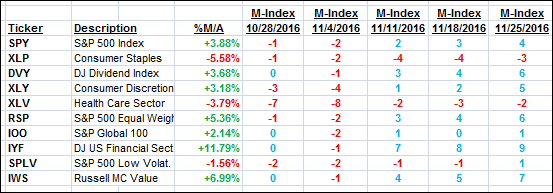
The above table simply demonstrates the magnitude with which some of the ETFs are fluctuating in regards to their positions above or below their respective individual trend lines (%M/A). A break below, represented by a negative number, shows weakness, while a break above, represented by a positive percentage, shows strength.
For hundreds of ETF choices, be sure to reference Thursday’s StatSheet.
Year to date, here’s how the above candidates have fared so far:
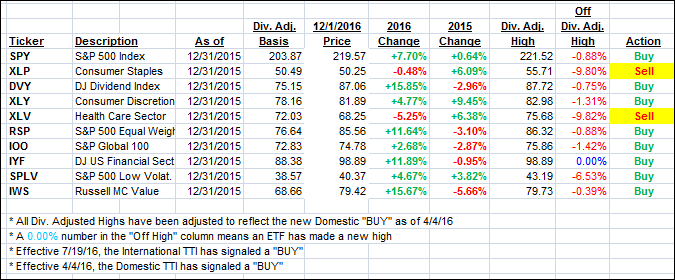
Again, the first table above shows the position of the various ETFs in relation to their respective long term trend lines (%M/A), while the second one tracks their trailing sell stops in the “Off High” column. The “Action” column will signal a “Sell” once the -7.5% point has been taken out in the “Off High” column.
- Trend Tracking Indexes (TTIs)
Our Trend Tracking Indexes (TTIs) slipped as the major indexes presented a negative bias despite the Dow making a new all-time high. However, when looking under the hood, the Dow’s gain was entirely generated by only 2 of its 30 stocks (GS, UNH), hardly a vote of confidence.
Here’s how we closed 12/01/2016:
Domestic TTI: +0.36% (last close +0.68%)—Buy signal effective 4/4/2016
International TTI: +1.61% (last close +1.74%)—Buy signal effective 7/19/2016
Disclosure: I am obliged to inform you that I, as well as my advisory clients, own some of the ETFs listed in the above table. Furthermore, they do not represent a specific investment recommendation for you, they merely show which ETFs from the universe I track are falling within the guidelines specified.
Contact Ulli