Weekly StatSheet For The ETF Tracker Newsletter – Updated Through 03/09/2017

Ulli ETF StatSheet Contact

ETF Data updated through Thursday, March 9, 2017

Methodology/Use of this StatSheet:

  1. From the universe of over 1,800 ETFs, I have selected only those with a trading volume of over $5 million per day (HV ETFs), so that liquidity and a small bid/ask spread are assured.
  2. Trend Tracking Indexes (TTIs)

Buy or Sell decisions for Domestic and International ETFs (section 1 and 2), are made based on the respective TTI and its position either above or below its long-term M/A (Moving Average). A crossing of the trend line from below accompanied by some staying power above constitutes a “Buy” signal. Conversely, a clear break below the line constitutes a “Sell” signal. Additionally, I use a 7.5% trailing stop loss on all positions in these categories to control downside risk.

  1. All other investment arenas do not have a TTI and should be traded based on the position of the individual ETF relative to its own respective trend line (%M/A). That’s why those signals are referred to as a “Selective Buy.” In other words, if an ETF crosses its own trendline to the upside, a “Buy” signal is generated. Since these areas tend to be more volatile, I recommend a wider trailing sell stop of 7.5% -10% depending on your risk tolerance.

If you are unfamiliar with some of the terminology, please see Glossary of Terms and new subscriber information in section 9.


  1. DOMESTIC EQUITY ETFs: BUY — since 4/4/2016
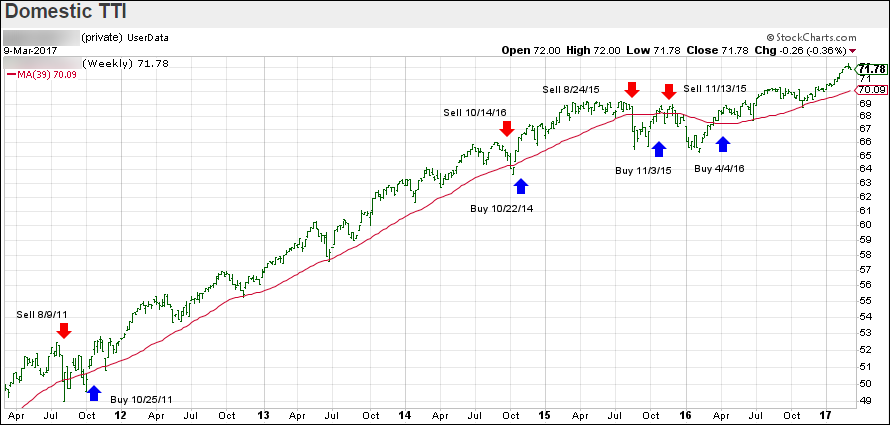
Click on chart to enlarge

Our main directional indicator, the Domestic Trend Tracking Index (TTI-green line in the above chart) is positioned above its long-term trend line (red) by +2.51% after having generated a new Domestic Buy signal effective 4/4/2016 as posted.
Read More

Equities Eke Out A Small Gain; Bonds Get Clobbered

Ulli Market Commentary Contact

[Chart courtesy of MarketWatch.com]
  1. Moving the Markets

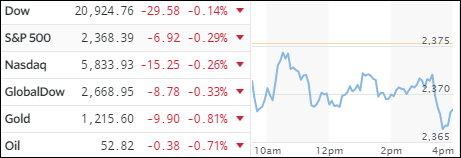
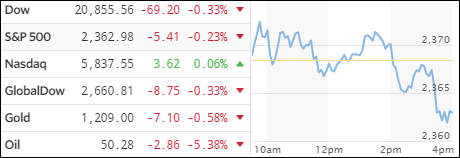
Another directionless day with the major indexes hovering below the unchanged line but a last minute ramp helped to get us into the green thereby avoiding a 6th straight loss for the Dow.

The indexes are now unchanged from Trump’s rally speech. Financial conditions remain tight with bonds having another ugly day as yields have now risen for 9 straight days. As ZH reports, the 10-year T-bond has not had a longer losing streak since 1974.

High yield credit too was negatively affected as well with the widely followed HYG ETF losing at the tune of -2.3% in March alone and breaking below its 50-day moving average.

There was not much strength anywhere as commodities headed south joined by precious metals and oil, which lost again after yesterday’s -5% drubbing.

The question in my mind is when will stocks notice? Especially in view of the fact that Macro data is deteriorating almost daily and GDP growth is also going the wrong way.

Read More

Oil Plunges; Market Weakness Continues

Ulli Market Commentary Contact

[Chart courtesy of MarketWatch.com]
  1. Moving the Markets

It was another mixed day in the markets as encouraging news via a stronger-than-expected ADP employment report was offset by a collapse in oil prices, which got hammered at the rate of -5.38%, their biggest drop in over a year, caused by a bearish inventory report.

The ADP report showed that private companies added the most jobs in three years in February (280k), which is interpreted as a sign of stronger economic growth. The U.S. government will issue its own broader jobs report on Friday, which will be the last reading before the Fed’s verdict on interest rates due out next week.

The 10-year yield jumped to 2.56% from 2.52% and is now in danger of crossing the 2.6% threshold level, which is widely associated with having a negative effect on equities. Of course, 2.6% is not a hard number, but a yield in the range of 2.6% to 3% is considered a warning sign; sort of the canary in the coalmine.

Ever since Trump’s speech to congress a week ago, the markets have been slipping and sliding, although the magnitude of the retreat has been small and only 0.9% as measured by the Dow. However, the sell-off has been broad based with macro data, emerging markets, copper, high-yield credit, REITs and crude oil all breaking down as “derisking” seems to have been the mantra.

For the time being, however, the major trend in the domestic investment arena, with the exception of a few sectors, remains bullish as my TTI indicator in section 3 below shows.

Read More

GDP Forecast Collapses; Are Stocks About To Follow?

Ulli Market Commentary Contact

[Chart courtesy of MarketWatch.com]
  1. Moving the Markets

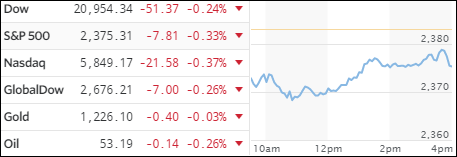
One look at the above chart and you’ll notice something that we have not seen in a long time. After the indexes spent all day below the unchanged line, the usual late afternoon ramp, which we’ve become accustomed to for a long time, did not materialize as stocks took a another dive but were saved from worse by a last minute upturn.

To me, things look sort of dicey right now. A week ago, the Fed announced via its various mouth pieces that a rate hike was imminent meaning it was forthcoming during their March 15 meeting, as Fed chief Yellen seemed to confirm during last Friday’s conference. While we all know that the Fed behind the curve with their rate hike effort, I think they are caught between a rock and a hard place.

According to the Atlanta Fed, the GDP forecast was revised from 1.8% last week to just 1.3% today. That is a huge drop, especially in view of the fact that this number was more than double, or 2.7%, just one month ago. This confirms what I have been pounding on for quite a while, namely that economic conditions are weakening and not strengthening as MSM reports almost daily. That condition would exactly be the wrong time for a rate hike.

If you consider that inflation officially has accelerated to 2.5%, you can see that GDP is actually in negative territory, which means the economy is shrinking and not expanding. Makes me wonder if stocks are finally catching on to this bitter reality? We’ll have to wait a while longer to be sure that the tide has actually turned; right now it looks as though this could be the proverbial canary in the coalmine.

Read More

Off The Lows But Still In The Red

Ulli Market Commentary Contact

[Chart courtesy of MarketWatch.com]
  1. Moving the Markets

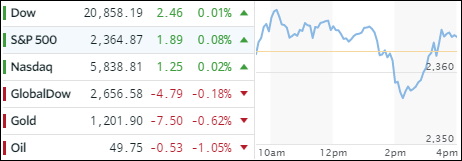
The major indexes started out the week on a negative note, rallied off the lows but did not manage to climb above the unchanged line. Setting the sour mood were news reports from N. Korea over the weekend that they had fired four ballistic missiles into the sea northwest of Japan. That was followed by tumultuous news from the Trump administration along with lack of details regarding his economic plans.

Add to that setbacks in filling his Cabinet posts and accusations of Obama wiretapping Trump power during the later part of the election campaign, and you have enough reasons to cast some questions as to the longevity of the post-election rally. For sure, once markets figure out that the Trump economic initiative, as well meaning as it may be, will not be executed in the expected time frame, you may see more weakness creep in.

One of the things discussed over the recent past was the question as to whether the entire Fed stimulus program of trillions of dollars over the past 8 years benefited Wall Street or Main Street. We just got the answer. Take a look at this chart:

Read More

One Man’s Opinion: US Government’s 2016 Net Loss “More Than Doubled” To NEGATIVE $1 Trillion

Ulli Market Review Contact

By Simon Black

Every year around this time the US federal government releases an annual financial report to the public.

It would be hilarious if the numbers weren’t actually true.

Just like Apple or Exxon, the government’s annual report contains several important financial statements and detailed commentary about their finances and operations.

But unlike Apple, Exxon, the government can’t manage to turn a profit. Ever.

According to this year’s report, the government’s net loss “more than doubled, increasing $533.2 billion (103.7%) during [Fiscal Year] 2016 to $1.0 trillion.”

It’s extraordinary that they lost $533 billion in 2015, let alone a full trillion in 2016.

Bear in mind, there was no major wars, recessions, or crises to fight.

What did you really receive in exchange for that trillion-dollar loss?

Brand new highway system? Giant tax rebate?

Nope. None of the above.

Read More